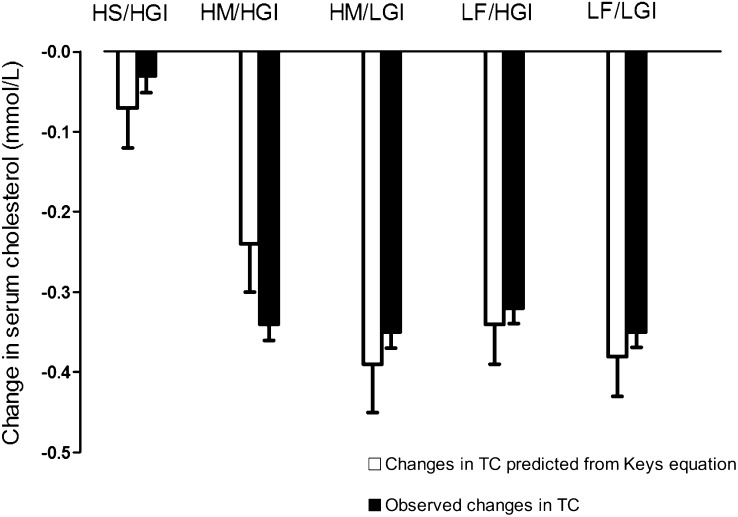
FIGURE 3.
Mean (±SEM) changes in total cholesterol (TC) compared with predicted changes from the Keys equation (27). Overall test of significance, P < 0.001 (ANCOVA). HS/HGI, high–saturated fatty acid and high–glycemic index diet; HM/HGI, high–monounsaturated fatty acid and HGI diet; HM/LGI, HM and low-GI diet; LF/HGI, low-fat and HGI diet; LF/LGI, LF and LGI diet.

