
Figure 6.
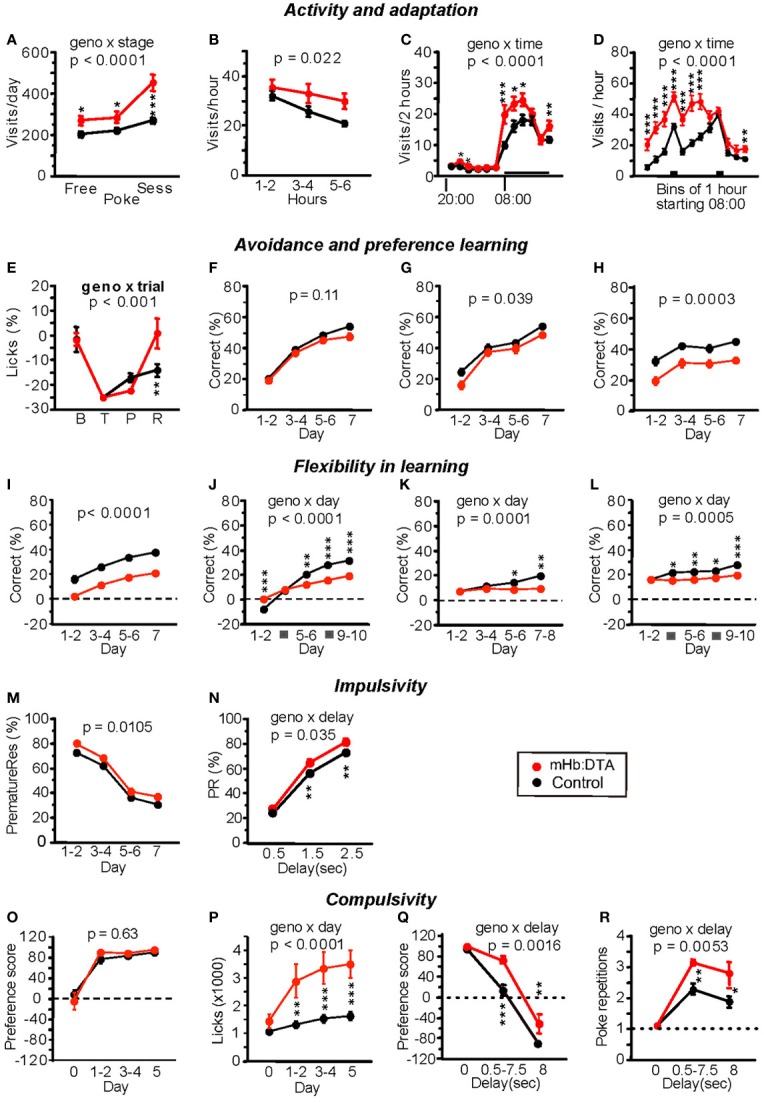
Behavioral phenotypes of mHb:DTA mice in the IntelliCage system. (A–D) Activity and adaptation. (A) Total mean visits per day during the second to last day of free, nose-poke, and session adaptation (mice were 4–5 months old, n = 12 for mHb:DTA and 24 for controls). The mHb:DTA mice were hyperactive during all stages, most strikingly during session adaptation [genotype F(1, 33) = 17.3, p < 0.0002; stage F(2, 66) = 51.2, p < 0.0001; stage × genotype F(2, 66) = 12.7]. (B) Visits during the first 8 h of free adaptation. mHb:DTA mice made significantly more visits with a time curve suggesting reduced habituation [F(1, 34) = 5.75]. (C) Diurnal distribution of total visits in bins of 2 h, averaged over days 2–7 of free adaptation. Horizontal bar indicates dark phase (08:00–20:00). mHb:DTA mice were hyperactive mainly during the first half of the dark phase [genotype F(1, 34) = 6.54, p = 0.015; time F(11, 374) = 133.4, p < 0.0001; time × genotype F(11, 374) = 6.5]. (D) Distribution of visits during the dark phase in 1-h bins averaged over days 2–7 of session adaptation. Bars indicate drinking sessions (11:00–12:00, 16:00–17:00) [genotype F(1, 33) = 31.2, p < 0.0001; time F(11, 363) = 64.8, p < 0.0001; time × genotype F(11, 363) = 10.0]. (E) Corner avoidance task. Licks to punished corner, expressed as a percentage of total licks, minus the chance level of 25%. Each point represents data for 24 h: baseline (B), training (T), probe trial (P), and retest after 3 days of extinction (R). Although mHb:DTA mice tended to show stronger avoidance of the punished corner during the probe trial, they showed an extinguished avoidance response after 3 days, unlike controls, [genotype F(1, 33) = 0.89, ns, trial F(3, 96) = 37.2 p < 0.0001, trial × genotype F(3, 96) = 5.93]. (F–H) Corner preference learning. (F) Correct choices were not significantly affected [F(1, 32) = 2.63]. (G) During reversal training, correct choices were slightly reduced in mHb:DTA mice [genotype F(1, 32) = 5.24, genotype × day F(3, 96) = 1.36, p = 0.26]. (H) During serial reversal training, mHb:DTA mice made fewer correct choices [genotype F(1, 32) = 16.2, genotype × day F(3, 96) = 0.22, p = 0.88]. (I,J) Chaining task (reward anti- or clockwise relative to last visit). (I) mHb:DTA mice performed less well, but learned at a similar rate as controls [genotype F(1, 32) = 38.9, genotype × day F(3, 96) = 0.33, p = 0.8]. (J) mHb:DTA mice learned at a slower rate but had an initial advantage over controls on the first day of reversal learning [genotype F(1, 32) = 6.7, p = 0.014, genotype × day F(4, 128) = 23.8, p < 0.0001]. (K,L) Patrolling task (reward anti- or clockwise relative to last correct visit). (K) Patrolling acquisition: mHb:DTA mice failed to learn this task [genotype F(1, 32) = 7.54, p = 0.0098, genotype × day F(3, 96) = 7.5]. (L) Patrolling reversal: mHb:DTA mice failed to show learning [genotype F(1, 32) = 7.84, p = 0.0086, genotype × day F(4, 128) = 5.38]. (M,N) Reaction time test, testing phase. mHb:DTA mice made more premature responses and their impairment was clearly delay-dependent [M, F(1, 31) = 7.42, genotype × day F(3.93) = 0.18, p = 0.55; N, genotype F(1, 31) = 7.432, p = 0.0104, delay F(2, 62) = 1009.4, p < 0.0001, delay × genotype F(2, 62) = 3.54]. (O,P) Saccharin preference. Day 0, water in all bottles; days 1–5, choice between water and saccharin in each corner. (O) Saccharin preference expressed as (S − W)/(S + W) × 100% (S = lick contact time at saccharin bottles, W = lick contact time at water bottles) rapidly reached near maximum values independent of genotype [F(1, 31) = 0.24]. (P) Increase in the lick contact time in mHb-Cre:DTA mice was boosted by saccharin exposure [genotype F(1, 31) = 15.4, p = 0.0004, genotype × day F(3, 93) = 12.1]. (Q,R) Delay discounting: saccharin delay increased 0.5 s/24 h from 0 to 8 s. mHb:DTA mice were significantly more resistant to abandoning saccharin [Q, genotype F(1, 31) = 16.1, p < 0.0004, delay F(2, 62) = 273.9, p < 0.0001, genotype × delay F(2, 62) = 7.17] and showed more compulsive nose-pokes at the closed saccharin door than controls [R, genotype F(1, 31) = 9.9, p < 0.0036, delay F(2, 62) = 58.7 p < 0.0001, genotype × delay F(2, 62) = 5.71]. Data represent mean ± SEM. Tukey–Kramer post-hoc test; *p < 0.05; **p < 0.01; and ***p < 0.001.