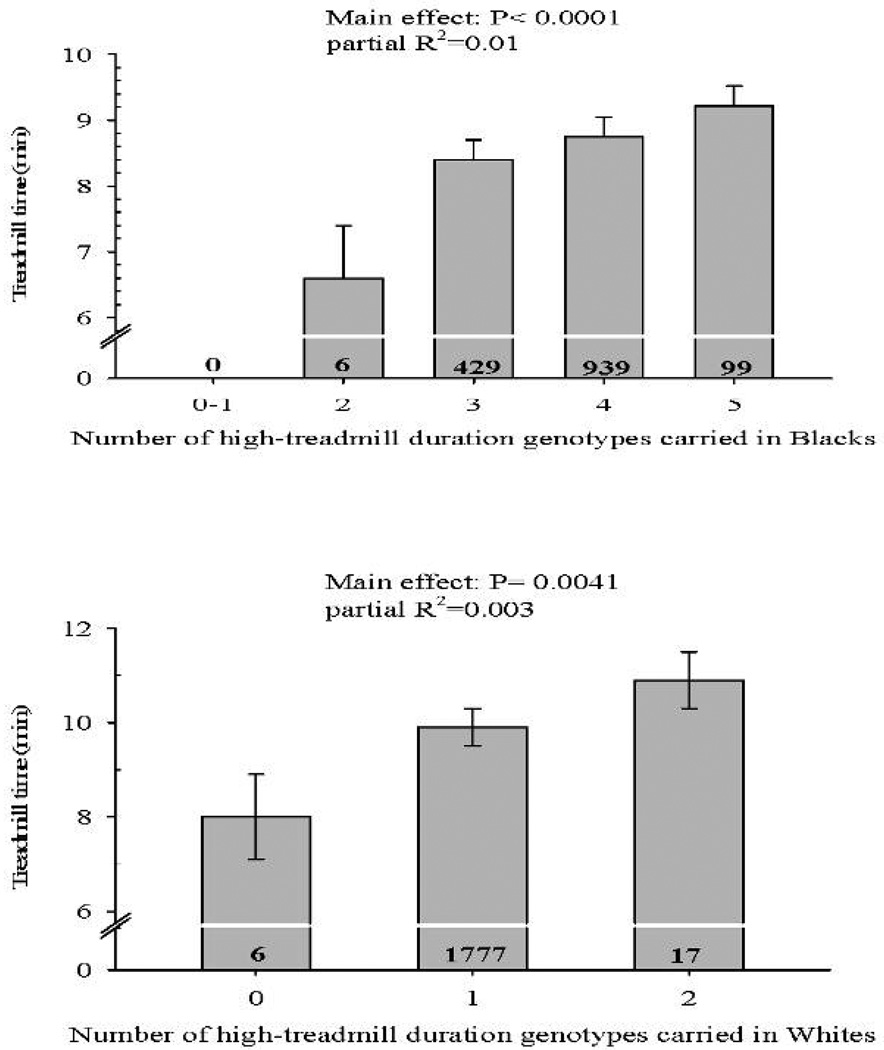
Figure 1.
Association of the number of high-treadmill duration genotypes with baseline exercise test duration at NOS3 rs3918196, ATP1A2 rs9660705, PPARGC1A rs7657517, PPARGC1A rs2932971, and HIF1A rs1957755 markers in Blacks (top panel) and HIF1A rs1957757 and PPARGC1A rs3774909 markers in Whites (bottom panel). P value for the main effect of high-treadmill duration genotypes along with variance in baseline duration explained by high-treadmill duration genotypes is shown at the top of each graph. Number of subjects with the selected number of genotypes is indicated inside each histogram bar.

