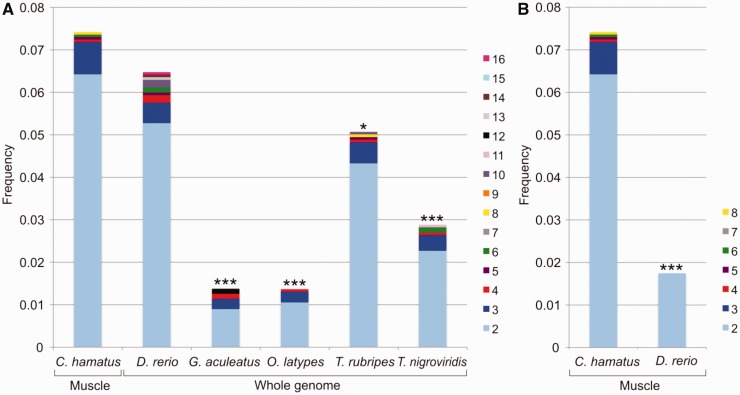
Fig. 3.—
Comparison of duplicated gene frequencies in different fish species. (A) Bar plots represent, for each species, the fraction of analyzed subtrees with at least one gene represented, including two or more duplicated genes. The proportion of Chionodraco hamatus duplicated genes, inferred in this study from the analysis of the muscle transcriptome, is pairwise compared with the proportion of duplicated genes of the five fish species for which the whole genome is available. Test of equal proportions: ***P value <0.001, **P value <0.01, and *P value <0.05, after Bonferroni correction for multiple tests. (B) Comparison of the proportion of duplicated genes expressed in muscle in C. hamatus and D. rerio.

