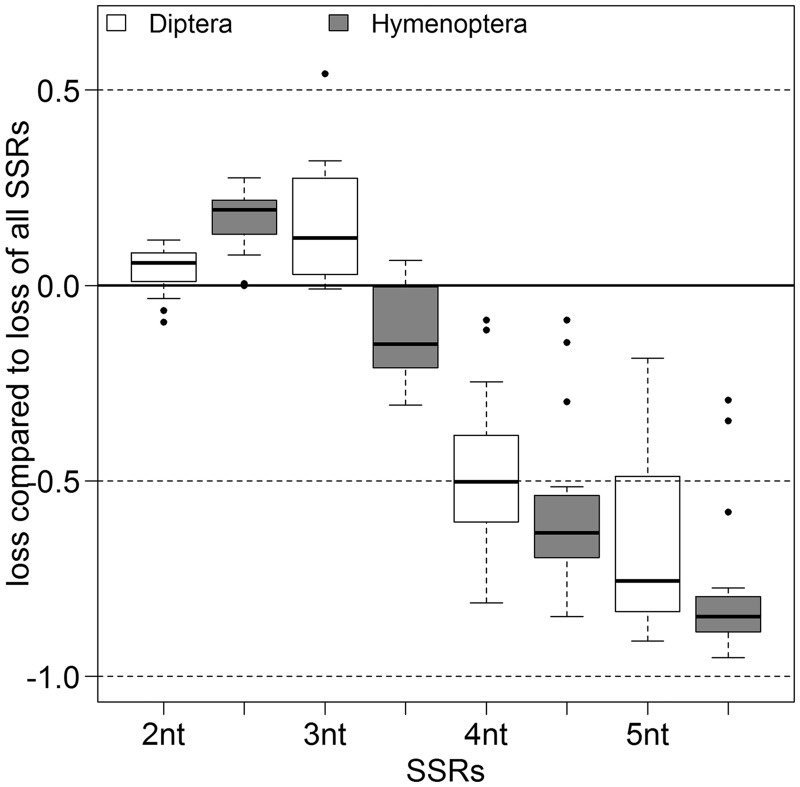
Fig. 4.—
Relative loss of SSRs by their motif length. The loss of di-, tri-, tetra-, and pentanucleotide SSRs compared with the loss of all SSRs (y = 0, indicated by a black line). The Diptera are shown in white and the Hymenoptera with gray filling. The black bar within the box shows the median. Black dots represent outliers. All groups are significantly different.

