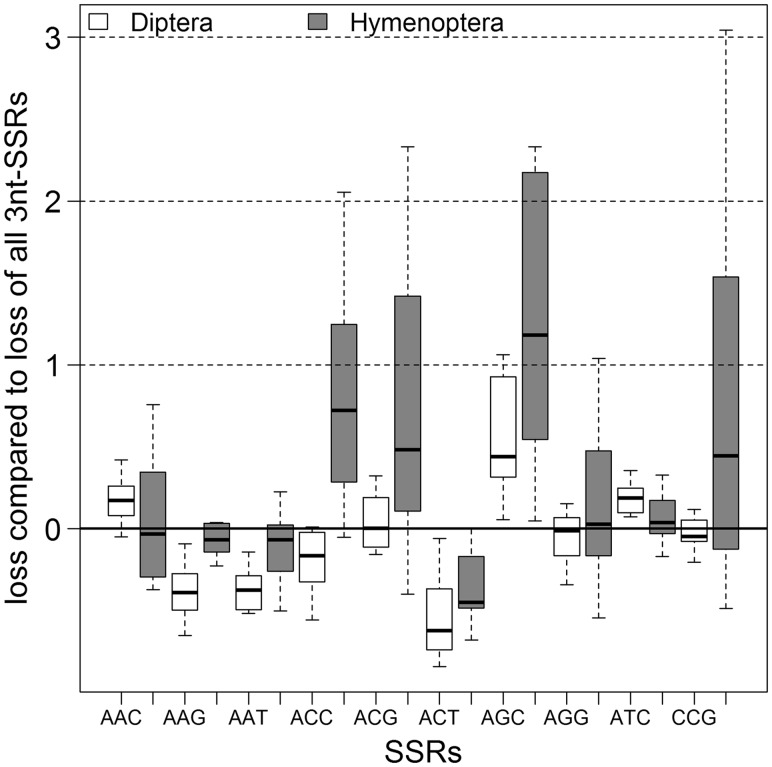
Fig. 6.—
Relative loss of 3 nt SSRs by their motif sequence. The loss of the different 3 nt SSRs compared with the loss of all 3 nt SSRs (y = 0, indicated by a black line). The Diptera are shown in white and the Hymenoptera with gray filling. The black bar within the box shows the median, outliers not shown.

