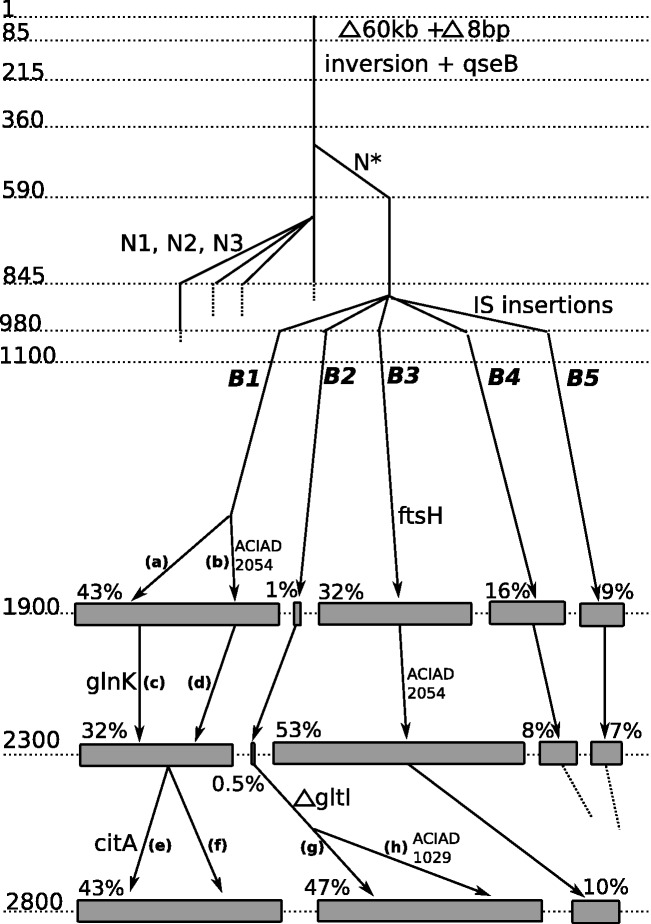
Fig. 2.—
Inferred evolutionary tree of the population, deduced by combining genome sequencing data analysis and systematic sequencing of PCR fragments performed on 87 isolated clones. The numbers on the left side indicate generations, estimated from the imposed dilution rate. Each vertical line corresponds to a subpopulation (not all subpopulations are displayed). Some relevant mutations are indicated at the time of appearance. N*, N1, N2, and N3 designate C1903816T, C1903797T, C1903844T, and C1903876T, respectively (table 1). Five branches arise before 1,000 generations, and three branches (B1, B2, and B3) are still present at the end of the experiment. For the last three time points, genomes extracted from population samples were resequenced; the sizes of the gray rectangles indicate the estimated relative population percentage of each branch (% values indicated immediately above rectangles) as deduced from genomic data analysis. The labels (a) to (f) designate specific subpopulations as follows: (a) branch B1 with no additional mutation, (b) branch B1 with an additional ACIAD2054 mutation, (c) =(a) with mutated glnk, (d) =(b) with no additional mutation, (e) additional mutation in citA, (f) no additional mutation in citA, (g) deletion in gltI, and (h) deletion in gltI, plus ACIAD1029 mutation.

