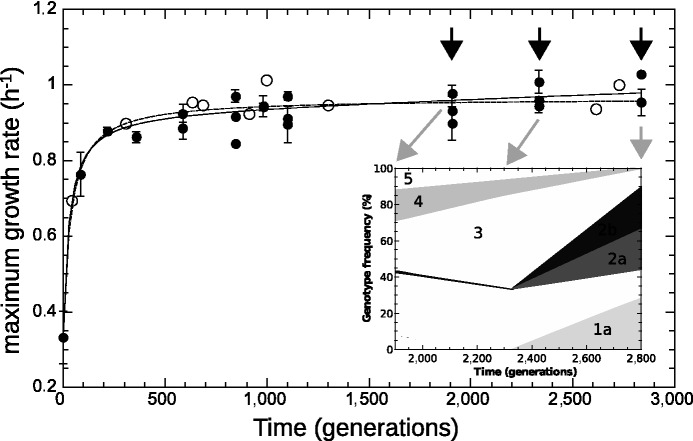
Fig. 3.—
Maximum growth rate from batch (black circles) and chemostat (open circles) measurements, plotted as a function of time (in generations). Chemostat measurements were performed during the experiment by transiently increasing the dilution rate above the wash-out threshold (open circles). Lines are fits with a hyperbola (dashed:  ) and with hyperbolic plus linear function (solid:
  ), as in Barrick et al. (2009). The maximum growth rate initially increases rapidly and drastically slows down after approximately 500 generations. The shaded area indicates the late stages of the experiment. Arrows indicate times of population sequencing. The inset plots the dynamics of frequencies related to some mutational events resulting from resequencing analysis in late stages of the experiment. Each number designates a branch identified by the IS insertion event. 1a, 2a, and 2b designate clearly identified subpopulations validated by PCR on isolated clones. Mutations shared by several branches or not verified by PCR are not represented.

