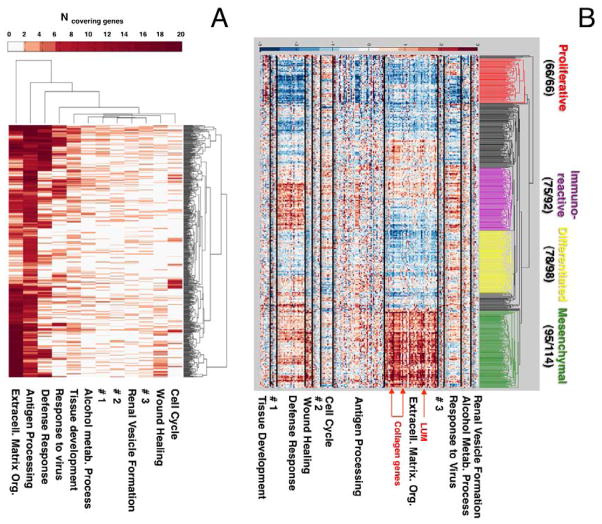
Figure 3. Modules in ovarian cancer obtained by the integrated module cover method.
(A) For each disease case (y-axis) we displayed in the heat map the number of genes in each module that covered the sample (B) Expression based clustering of the genes in the modules provided clusters consistent with the existing classification of cancer subtypes. Arrows indicate genes of the extracellular matrix module discussed in the text. The fraction of genes assigned to a given cluster in (18) is shown next to the cluster name.

