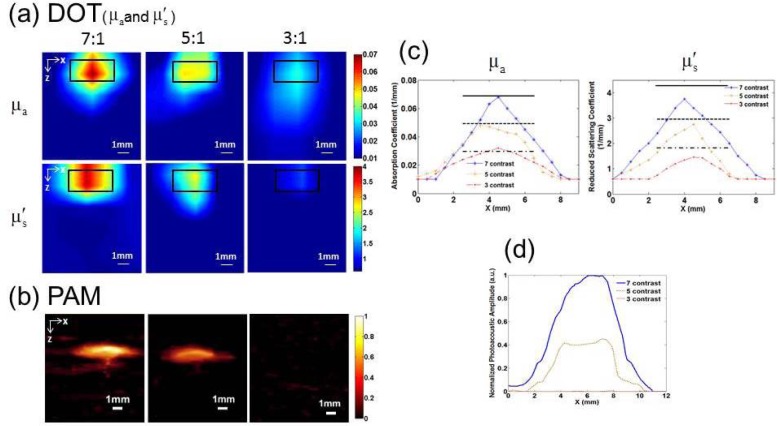
Fig. 4.
Reconstructed and images from DOT (a) and PAI (b) images for a target having 7, 5 and 3 times contrast, respectively. The target had a 4mm diameter and 2mm thickness. The back box in (a) indicates the exact target location. (c) Recovered (left) and (right) values along a transect crossing the center of each target for the images shown in (a). (c) Normalized photoacoustic signal amplitude along a transect crossing the center of each target for the images shown in (b).

