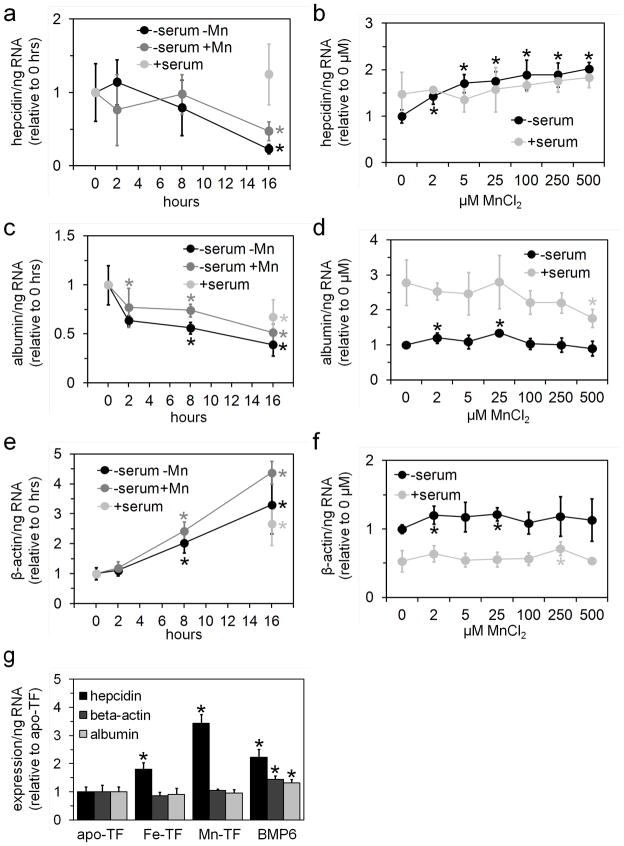
Fig. 2.
Effect of manganese on hepatocyte hepcidin levels: (a, c, e) Primary hepatocytes were treated in serum-free media (Optimem) without (black circles) or with 100 μM MnCl2 (dark gray circles) or in serum–replete media (containing 10% fetal calf serum) without added MnCl2 (light gray circles) for 0–16 hours then harvested and analyzed by QPCR for hepcidin (a), albumin (c) and β-actin (e) RNA levels. Values are normalized to 0 hour value; asterisks indicate value differs significantly (t-test P<0.05) from 0 hour value. (b, d, f) Primary hepatocytes were treated in serum-free (dark circles) or –eplete media (light gray circles) with 0–500 μM MnCl2 for 16 hours then harvested and analyzed by QPCR for hepcidin (b), albumin (d) and β-actin RNA levels (f). Values are normalized to 0 μM MnCl2 serum-free value; asterisks indicate value differs significantly (t-test P<0.05) from 0 μM MnCl2, same serum treatment. (g) Primary hepatocytes were treated in serum-free media with or without 3 mg/mL apo-TF, 100% saturated Fe-TF or 50% saturated Mn-TF or 50 ng/mL BMP6 overnight, then analyzed for expression levels as in (a–f). Asterisks indicate value differs significantly (t-test P<0.05) from apo-TF value. For all panels, gene RNA levels were expressed relative to total ng RNA used for QPCR; bars indicate standard deviation; each value represents the average of 4–6 biological replicates

