
Figure 6.
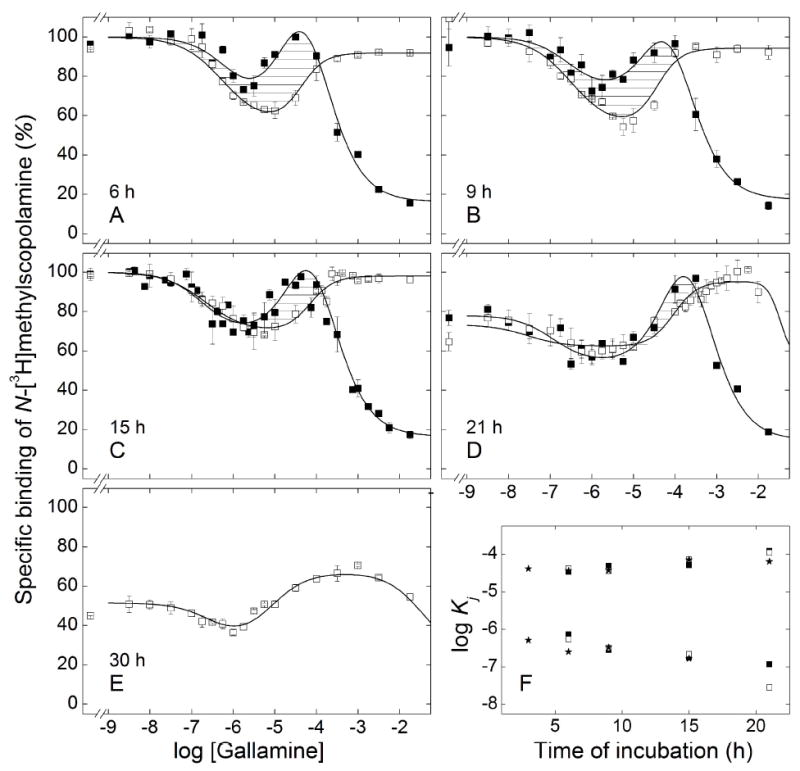
Effect of the order of mixing on the equilibration of gallamine and N-[3H]methylscopolamine with solubilized M2 receptor from porcine atria. Aliquots of the extract were premixed with [3H]NMS at a concentration of 10 nM (□) or with gallamine at the concentrations shown on the abscissa (■), and the mixture was incubated for 2 h at 30 °C. The second ligand then was added, and total binding was measured after further incubation at 30 °C for different times as follows: 6 h (A), 9 h (B), 15 h (C), 21 h (D), and 30 h (E). The lines depict the best fit of Equation 3 (n = 2 or 3) to the data represented in panels A–D taken together or to the data represented in Panel E, and the parametric values are listed in Table 5. Details regarding the normalization of the data are described under ‘Experimental Procedures.’ The estimates of log Kj obtained for different orders of mixing are compared in panel F (★, simultaneous addition of gallamine and [3H]NMS; ■, prior addition of gallamine; □ prior addition of [3H]NMS). Values shown for the simultaneous addition of gallamine and [3H]NMS are from Table 3; those for sequential addition are from Table 5.