
Figure 7.
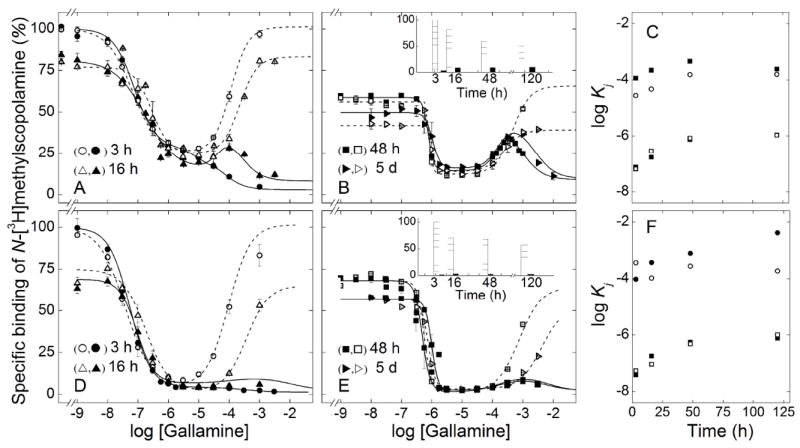
Effect of the order of mixing on the equilibration of gallamine and N-[3H]methylscopolamine with M2 receptor in membranes from porcine atria and Sf9 cells. Membranes from Sf9 cells (A, B) or porcine atria (D, E) were mixed simultaneously with gallamine and [3H]NMS (0.3 nM) (closed symbols) or first with [3H]NMS (0.3 nM) and then with gallamine after incubation of the initial mixture for 30 min at 24 °C (open symbols). Total binding was measured after further incubation at 24 °C for different times as follows: 3 h○,(●) and 16 h (Δ,▲) (A, D), 48 h (□,■) and 5 d (▷,▶) (B, E). The lines depict the best fit of Equation 3 (n = 2 or 3) to data obtained after simultaneous mixing (solid lines) or after premixing with [3H]NMS (broken lines), and the parametric values are listed in Table S10. The asymptotic values of Equation 3 for each time of incubation after simultaneous mixing with are compared in the insets to panels B (Sf9 cells) and E (atria) (Y[G]→0, hatched bars; Y[G]→∞, solid bars). The fitted values of log Kj from Table S10 are shown in panels C (Sf9 cells) and F (atria) for log K1 (□,■) and log K2 (○,●) after simultaneous mixing (■,●) and premixing with [3H]NMS (□,○).