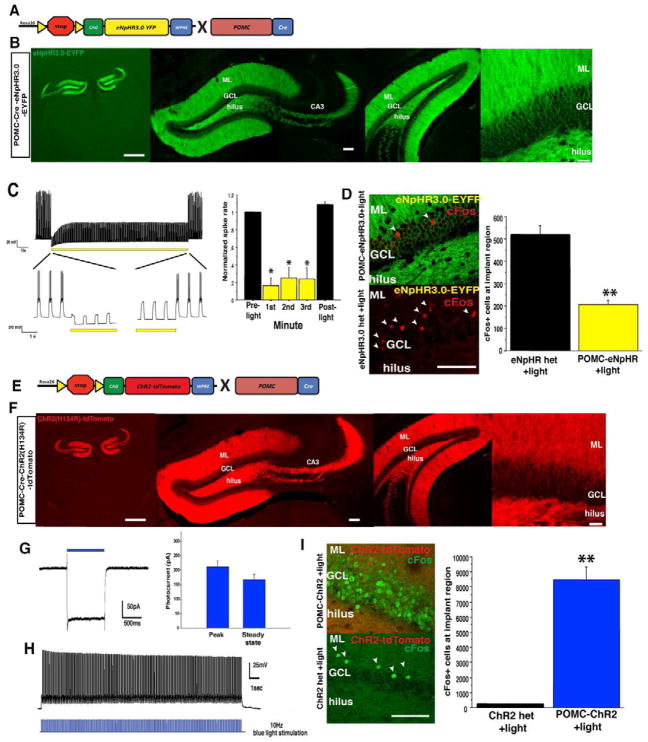
Figure 1. Optogenetic control of dentate gyrus granule cells.
(A) Genetic design for eNpHR3.0-YFP expression in DG GCs. (B) Expression of eNpHR3.0 in DG GCs, scale bar left, 1mm, middle 100um, right 30um. (C) Extended 3-minute illumination blocks evoked spiking in GCs, quantified on the right (n = 6, Mann-Whitney tests, planned comparisons, p < 0.05 for each minute). (D) Yellow light illumination of the dorsal DG in vivo reduces the number of cells positive for the immediate early gene cFos in the GCL region below the implanted fiber optic (scale bar, 100um), quantified on right (n=4/geno, t6= 6.7, p<0.001) (E) Genetic design for ChR2-tdTomato expression in DG GCs. (F) Expression of ChR2-tdTomato in DG GCs, scale bar left, 1mm, middle 100um, right 30um. (G) Voltage-clamp trace showing cationic current evoked by 1s pulse of 473nm light, average peak and steady state current amplitudes are quantified on the right. (H) Example current clamp record of spiking GC following a 10Hz train of 20 msec pulses. (I) Blue light illumination of the dorsal DG (10Hz, 20ms pulses) led to induction of cFos in a cohort of DG GCs (scale bar, 100um), quantified on the right (n=3–4/geno, t5=8.2, p<0.001). **p<0.01.

