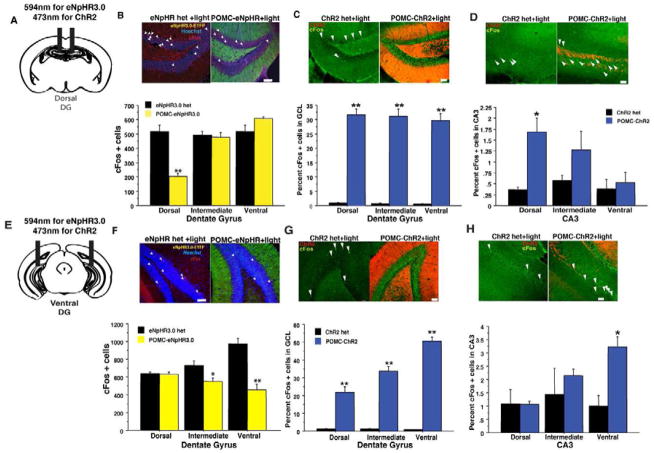
Figure 2. Illumination of the DG in POMC-eNpHR3.0 and POMC-ChR2 mice in vivo modulates cFos levels in the hippocampus in a region specific manner.
Yellow light Illumination of the dorsal (B) or ventral (F) DG of POMC-eNpHR3.0 mice during exploration of a novel environment (20min constant illumination) reduces total number of cFos immunoreactive cells in the GCL in the region below the implanted fiber optic. (dorsal implants, n=4/geno, repeated measures ANOVA, genotypeXregion interaction F(2,12)=45.1, p<0.01, ventral implants, n-4–5/geno, F(2,14)=23.8, p<0.01. (C, G) Blue light illumination of the (5min, 10 Hz illumination in a novel environment) of the dorsal (C), or ventral DG (G) in POMC-ChR2 mice can increase percent of cFos+ cells (% Hoechst 33342) throughout the GCL, but leads to modest induction in CA3 in a region-specific manner (D, H), in the region of the implanted fiber optic, most likely via direct stimulation of mossy fiber axons projecting towards CA3 (dorsal implants DG: n=3–4/geno, repeated measures ANOVA, genotype effect, F(1,5)= 148.4, p<0.0001, geno X region F(2,10)=0.5, p=0.6, CA3:, repeated measures ANOVA, geno X region F(2,10)=6.8, p=0.01. Ventral implants DG: repeated measures ANOVA, genotype effect, F(1,3)= 297.5, p<0.01, geno X region, F(2,6)=1321, p<0.001, CA3:, repeated measures ANOVA, geno X region F(2,6)=5.2, p<0.05. Scale bars represent 50um, *p<0.05, **p<0.01. All error bars are +/− SEM.

