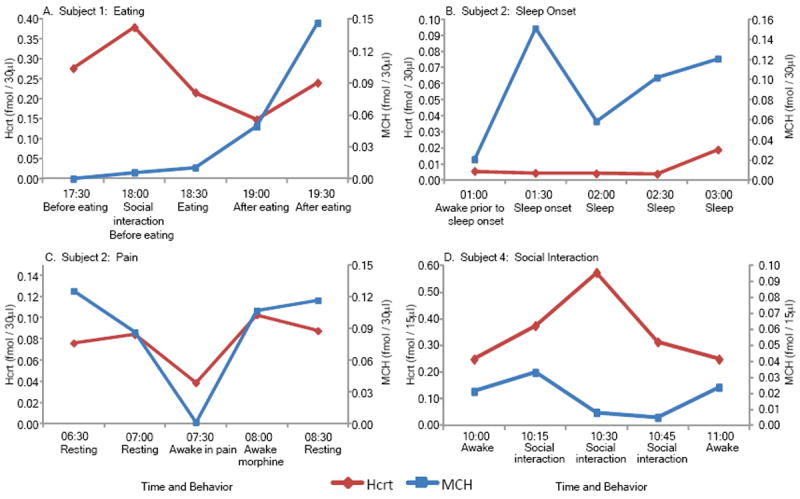
Figure 3.

Examples of single case raw data on Hcrt and MCH release from individual patients. Release pattern over time shows that (A) MCH levels increase after eating, (B) MCH levels increase at sleep onset, (C) both Hcrt and MCH levels are low during pain and (D) Hcrt levels increase with social interaction. With the exception of the example shown in C, all data in this study were collected during morphine-free periods. See figure 2 for average levels in each condition.
