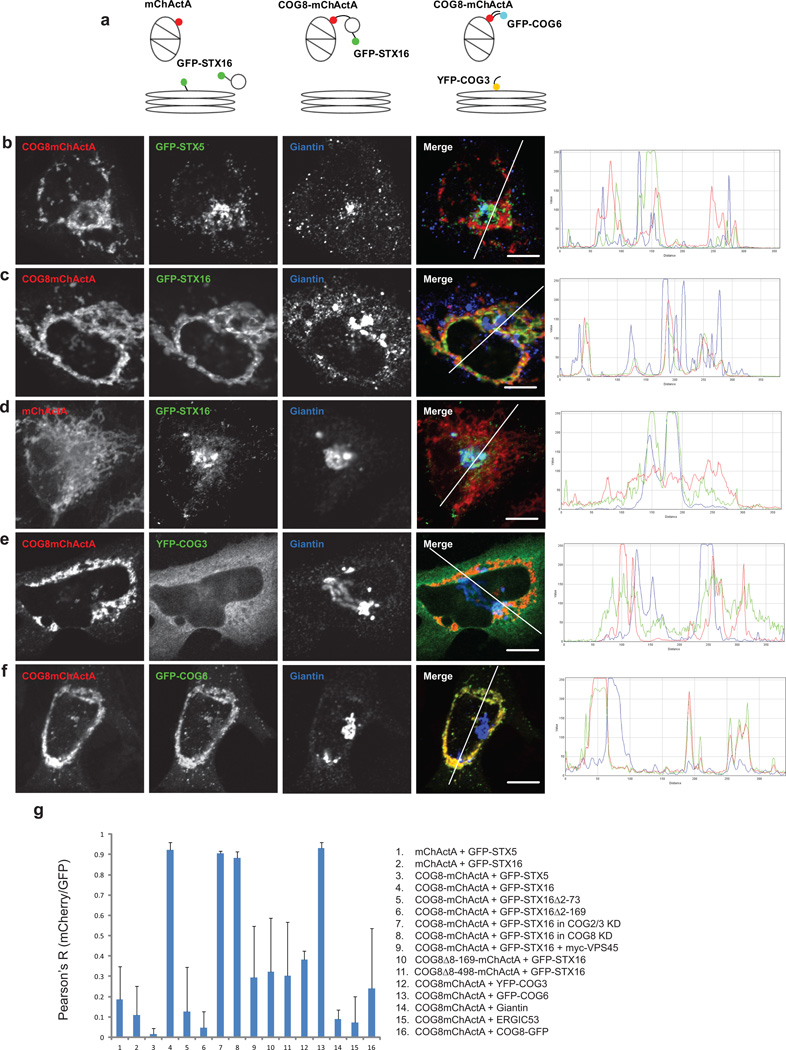
Figure 4. Mitochondria-targeted COG8 relocates STX16 vesicles and attracts obe B COG subunits.
A schematic diagram of the mitochondrial targeting protein constructs (a). HeLa cells transiently expressing GFP-STX5 (b), GFP-STX16 (c, d), or stably expressing YFP-COG3 (e), or GFP-COG6 (f), were transfected with a plasmid encoding either mChActA (d) or COG8-mChActa (b, c, e, f). 24 h after transfection cells were fixed, stained with antibodies to Giantin, and analyzed by confocal microscopy. Line plots for overlap between red, green and blue channels are shown measuring the relative value of signal intensity (y-axis) over the distance measured in pixels (x-axis). Size bar, 10 µm. Plot for the average Pearson coefficient for colocalization between mCherry/red and GFP/green signal for the indicated constructs and proteins (g) error bars represent standard deviation, n≥3.

