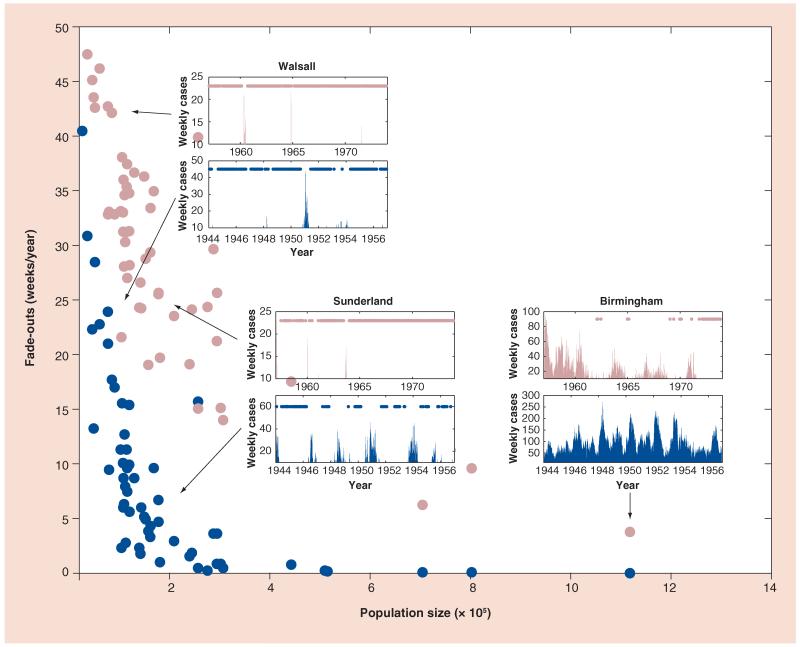
Figure 3. Pertussis extinction profiles in England and Wales.
For the 60 largest cities, the authors plot the number of weeks per year during which no pertussis cases were reported against the respective population size. The prevaccine (1944–1957) and vaccine (1957–1974) era are plotted in dark and light filled circles, respectively. To illustrate the concept, the incidence reports for three different cities, Birmingham, Sunderland and Walsall, for both prevaccine (dark) and vaccine (light) eras have also been presented. The dots in these insets indicate that no pertussis cases were reported during that week.

