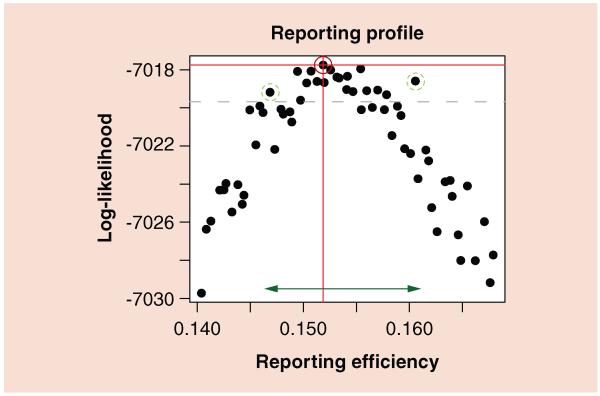
Figure 5. Likelihood profile for the reporting efficiency obtained from analyses of the Copenhagen pertussis data described in Figure 4.
Log-likelihood values that fall below the dashed line are outside the approximate 95% CI of the maximum likelihood estimate. The dark, solid circled point has the highest log-likelihood, and therefore corresponds to the maximum likelihood estimate for the reporting efficiency, 0.152. The two light, dashed circled points correspond to the most extreme reporting probabilities that have likelihoods within the confidence bounds, and the arrow at the bottom shows the CI for reporting efficiency, 0.147–0.161.

