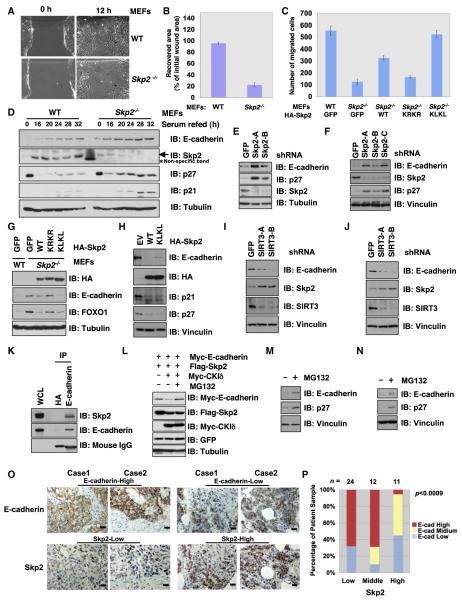
Figure 6. Cytosolic Skp2 Plays a Critical Role in Cellular Migration.
(A and B) Skp2 is required for cell migration. WT and Skp2−/− MEFs were plated for in vitro wound healing assays (A). Results in (A) were quantified in (B) and presented as mean ±SD from three independent experiments.
(C) WT and Skp2−/− MEFs were infected with the indicated viral constructs before plating for transwell assay. The results were quantified and presented as mean ±SD from three independent experiments.
(D) IB analysis of WT and Skp2−/− MEFs, synchronized by serum starvation for 72 hr and then released by readdition of serum for the indicated periods.
(E and F) IB analysis of normal human fibroblasts (E) or SKOV3 epithelial cancer cell line (F) infected with the indicated lentiviral shRNA vectors.
(G) IB analysis of WT and Skp2−/− MEFs infected with the indicated viral constructs.
(H) IB analysis of DU145 cells infected with the indicated viral constructs.
(I and J) IB analysis of MCF7 (I) or ZR75 epithelial cancer cell line (J) infected with the indicated lentiviral shRNA vectors.
(K) IB analysis of MCF7 WCL and anti-E-cadherin IP. Anti-HA IgG was used as a negative control for the immunoprecipitation procedure.
(L) IB analysis of WCL of HeLa cells transfected with the indicated plasmids. Cells were treated 20 hr posttransfection with the proteasome inhibitor MG132 overnight before harvesting.
(M and N) IB analysis of WCL derived from DU145 (M) or SKOV3 (N) cells treated with 10 μM MG132 for 12 hr before harvesting.
(O and P) Representative images of E-cadherin and Skp2 expression in breast tumor cells as assessed by immunohistochemistry (O). Both Skp2 and E-cadherin levels were classified as low, medium, or high based on the intensities of the IHC staining, and the percentages of patients classified in each category are depicted in the histogram in (P).
See also Figure S6.

