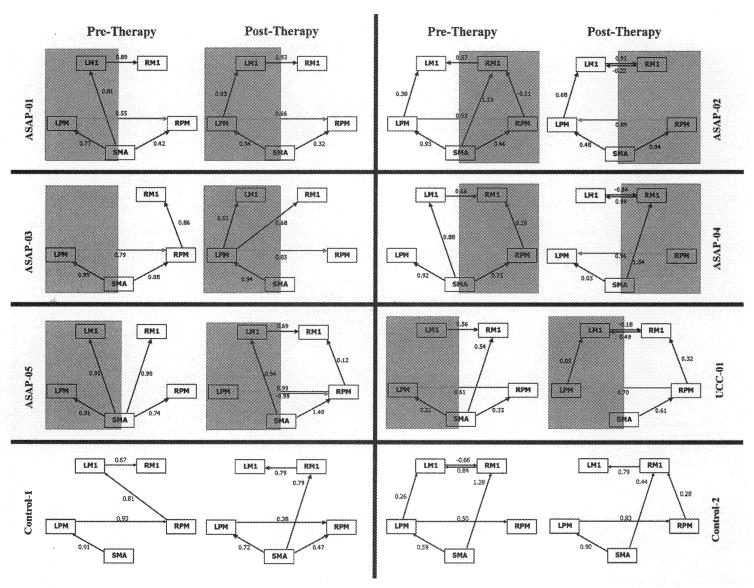
Figure 2.
Motor system network for each stroke survivor, before (session 1) and after (session 2) therapy. Shading indicates the hemisphere that is affected by stroke. SEM models are shown for each patient’s first session (left) and second session (right) after therapy. The numbers above each line represent the path coefficients and are standardized measures of direct influence. Solid lines with arrows indicate direction of effective connectivity influence. LM1=left primary motor cortex; RM1=right primary motor cortex; LPM = left premotor cortex; RPM=premotor cortex; SMA=supplementary motor area.

