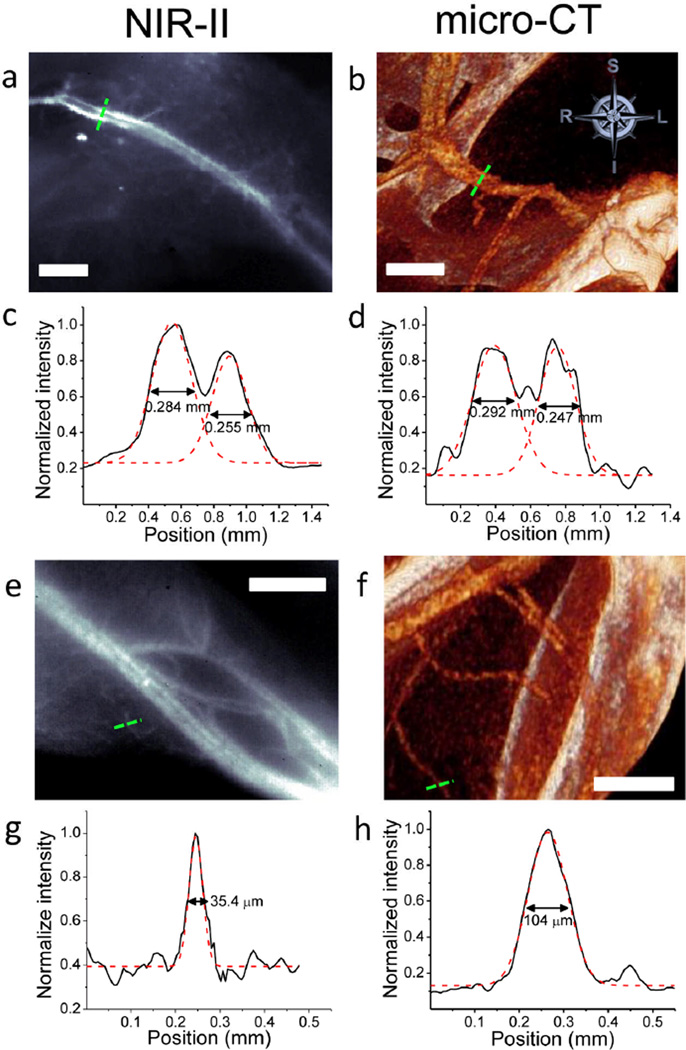
Figure 2.
NIR-II fluorescence and micro-CT imaging of hindlimb blood vessels. (a) A NIR-II SWNT fluorescence image of a mouse thigh. (b) A micro-CT image showing the same area of the thigh as in a. (c) A cross-sectional fluorescence intensity profile measured along the green dashed bar in a with its two peaks fitted to Gaussian functions. (d) A cross-sectional intensity profile measured along the green dashed bar in b with its two peaks fitted to Gaussian functions. (e) An NIR-II image at the level of the gastrocnemius. (f) A micro-CT image showing the same area of the limb as in e. (g) A cross-sectional fluorescence intensity profile measured along the green dashed bar in e with its peak fitted to a Gaussian function. (h) A cross-sectional intensity profile measured along the green dashed bar in f with its peak fitted to a Gaussian function. All scale bars indicate 2 mm.

