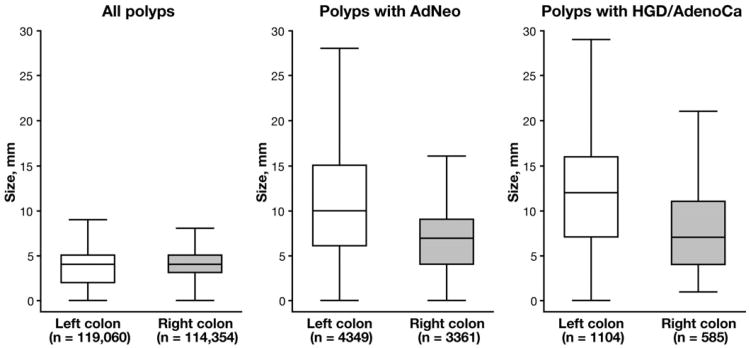
Figure 1.
Size distribution of all polyps, regardless of histology, as well as polyps with AdNeo and HGD/AdenoCa in right vs left colon. Distribution of all polyps, regardless of histology in right and left colon, were similar. However, polyps in right colon with AdNeo or HGD/AdenoCa were smaller than polyps with advanced histology in left colon, P < .001. For each box, the middle line represents median, the upper box boundary represents 75th percentile, and the lower boundary represents 25th percentile. For each plot, upper whisker represents distance to upper adjacent value within 1.5 interquartile range, and lower whisker represents distance to lower adjacent value within 1.5 interquartile range; outliers beyond the upper and lower adjacent values were suppressed to enhance plot clarity.

