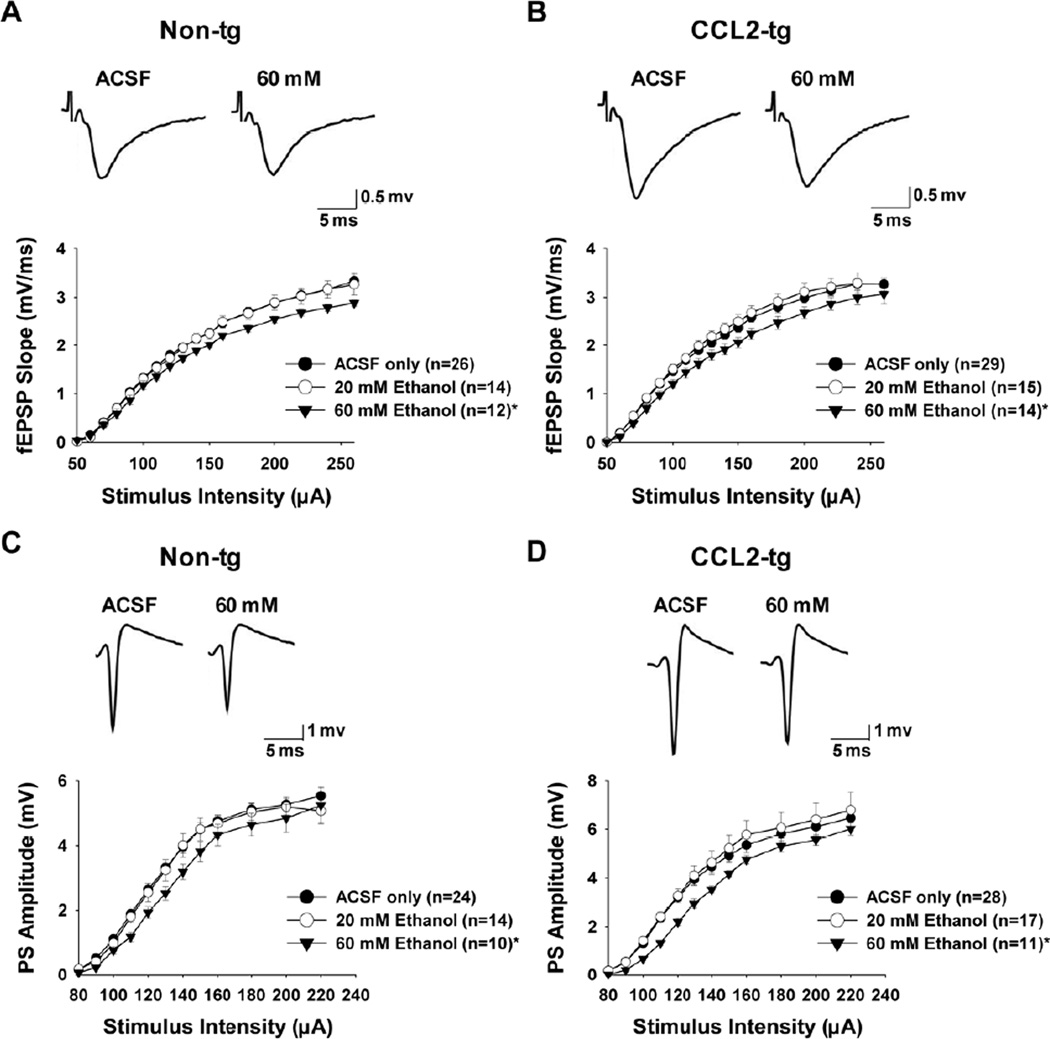
Fig. 3.
Affect of acute ethanol on input-output (I/O) curves measured in the CA1 region of hippocampal slices from CCL2-tg and non-tg mice. (A-B) I/O curves constructed from the mean values of the fEPSP slope in the presence of 20 mM (open circles) and 60 mM ethanol (closed triangles) in non-tg (A) and CCL2-tg (B) hippocampal slices. 20 mM acute ethanol had no effect on the I/O relationship for the fEPSP slope in either the non-tg (A) or CCL2-tg (B) hippocampal slices. 60 mM acute ethanol significantly decreased the I/O relationship for the fEPSP slope in both non-tg (p=0.033) and CCL2-tg hippocampal slices (p=0.048). (C-D) I/O curves constructed from the mean values of the population spike (PS) amplitude in the presence of 20 mM (open circles) and 60 mM ethanol (closed triangles) in non-tg hippocampal slices. 20 mM acute ethanol had no effect on the I/O relationship for the PS in either the non-tg (C) or CCL2-tg (D) hippocampal slices. 60 mM acute ethanol significantly decreased the I/O relationship for the PS in both non-tg (p=0.003) and CCL2-tg (p=0.001) hippocampal slices. Representative recordings of data for the I/O relationship are shown above each graph. Statistical analysis was determined using repeated measures ANOVA. * Indicates a significant difference between ethanol and ACSF treated hippocampal slices.

