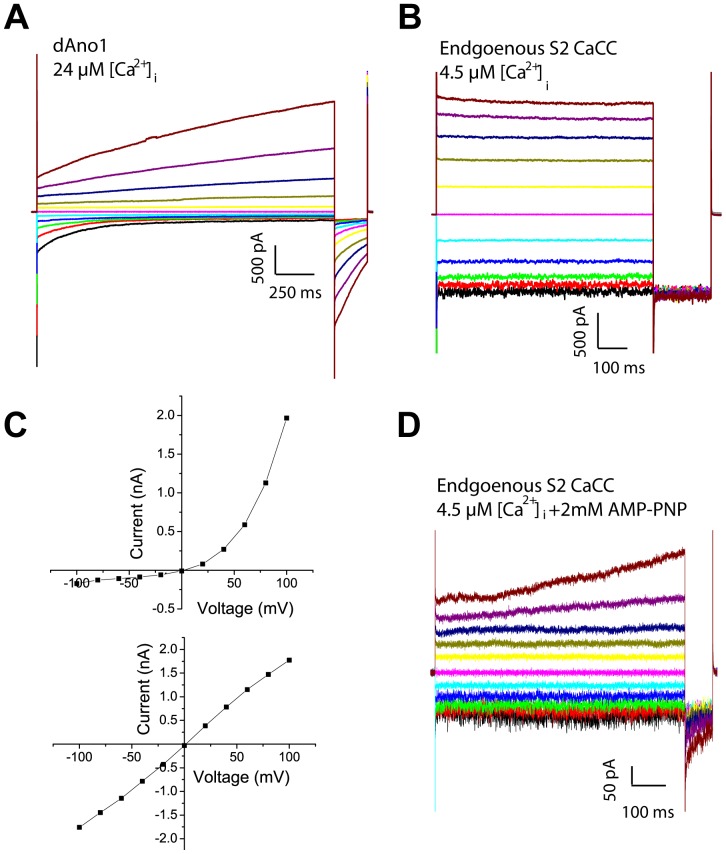
Figure 1. Comparison of endogenous S2 CaCC with heterologously expressed dAno1.
A) Whole-cell recording from HEK cell expressing dAno1 using voltage steps from −100 mV to +100 mV applied in 10 sec intervals. B) Endogenous S2 cell CaCC current response to voltage steps from −100 mV to +100 mV in the presence of 4.5 µM intracellular Ca2+. C) IV curves from A (top) and B (bottom). D) Representative recording of endogenous S2 cell CaCC current in the presence of 2 mM AMP-PNP in the intracellular solution. The current is largely blocked, but a small Ano1-like current remains.

