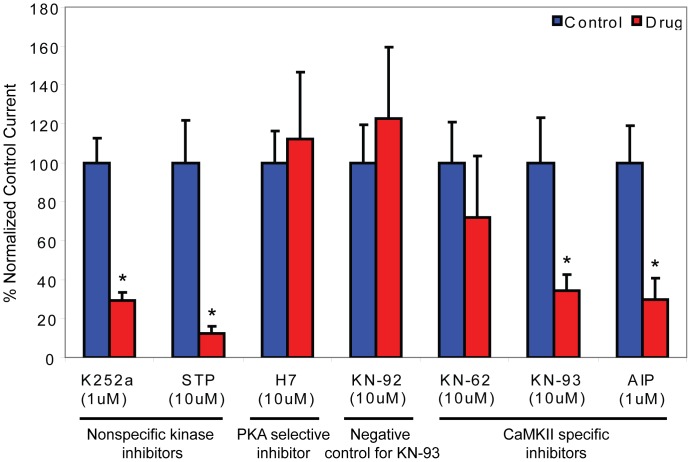
Figure 6. Comparison of the effects of various kinase inhibitors.
Currents were measured at 100 mV 300-s after break-in. Data represent the percentage of the normalized control current. Error bars indicate mean +/− SEM. Asterisks denote currents that are significantly different from control currents as determined by student’s t-test (p<0.05). N = 5–8 for all conditions.

