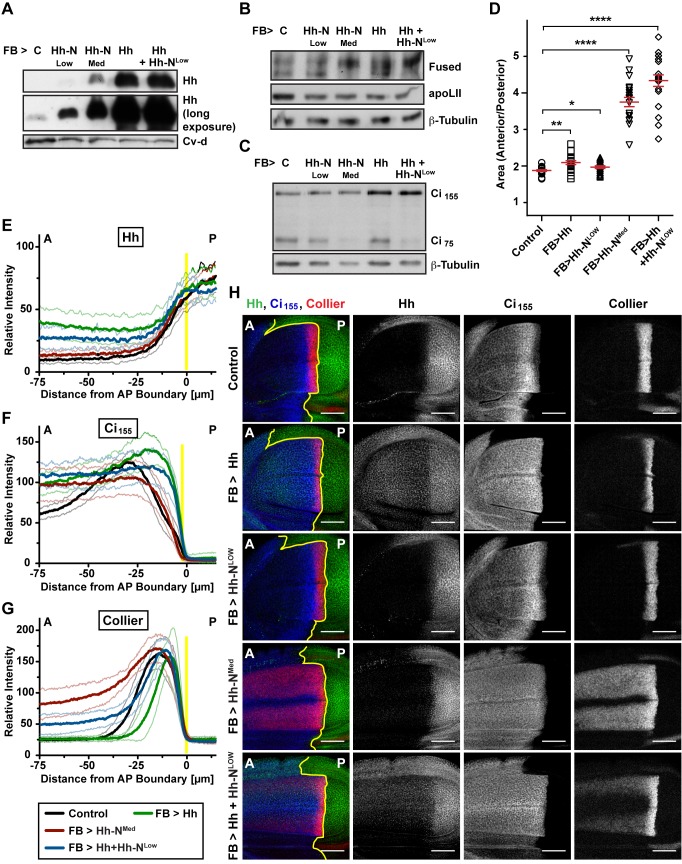
Figure 6. Signaling properties of Hh-N.
(A) Hemolymph Hh levels of larvae secreting Hh, Hh-NMed, Hh-NLow, or Hh+Hh-NLow from the fat body, analyzed by WB. (B) Phosphorylation status of Fused in wing discs from larvae secreting different combinations of Hh and Hh-N from the fat body, analyzed by WB. (C) Levels of Ci repressor (Ci75) and Ci155 (full-length) in wing discs of larvae secreting different combinations of Hh and Hh-N from the fat body, analyzed by WB. (D) Wing disc anterior to posterior compartment ratio of larvae secreting different combinations of Hh and Hh-N from the fat body. Error bars indicate ± SEM (n = 20). *p<0.05; **p<0.005; ***p<0.0005; ****p<0.00005. (E–G) Quantification of (E) Hh, (F) Ci155, and (G) Collier staining of wing discs shown in (H). Translucent lines indicate ± SD (n = 12). (H) IF of wing discs from larvae secreting different combinations of Hh and Hh-N from the fat body, stained for Hh, Ci155, and Collier. A denotes the anterior compartment, P the posterior compartment; yellow lines indicate the compartment boundary. Scale bar = 50 µm.

