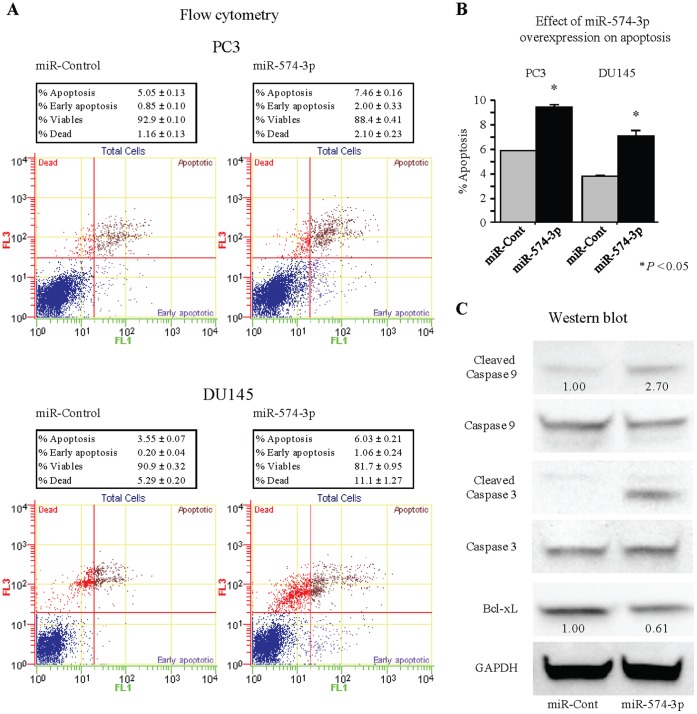
Figure 3. Effect of miR-574-3p overexpression on apoptosis.
(A) Apoptosis assay using flow cytometry. Representative quadrant figures of miR-control and miR-574-3p transfectants in PC3 (upper) and DU145 (lower) cells. (B) The bar chart indicates the ratio of apoptotic cell fractions (early apoptotic plus apoptotic cells) in miR-574-3p transfectants compared with controls. Data for the apoptotic cell fractions are expressed as the relative value for the average expression of the miR-control transfectant. *, P<0.05. (C) Immunoblots analysis for apoptotic markers in miR-control and miR-574-3p transfected DU145 cells. GAPDH was used as a loading control.

