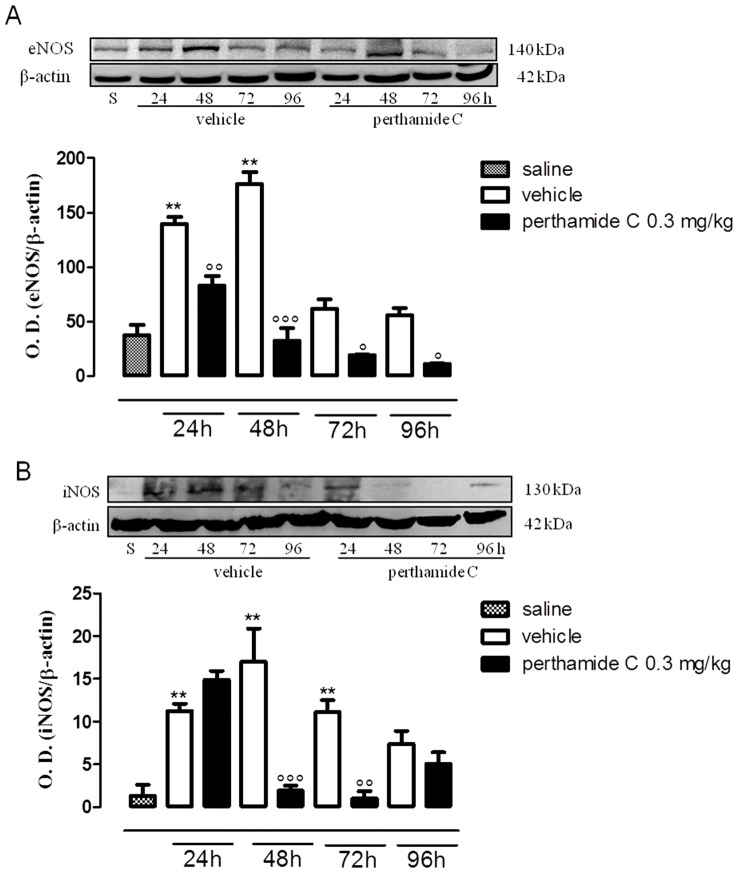
Figure 3. Western blot analysis of eNOS and iNOS in the late phase of the paw edema.
Expression of eNOS (A) and iNOS (B) were evaluated in paws homogenates obtained from mice treated with perthamide C, vehicle or saline at 24, 48, 72, 96 h following λ-carragenan injection. (n = 4 paws for each treatment and time point)**P<0.01vs saline, ° P<0.05, °° P<0.01, °°° P<0.001 vs vehicle. Image is representative of three separate experiments.

