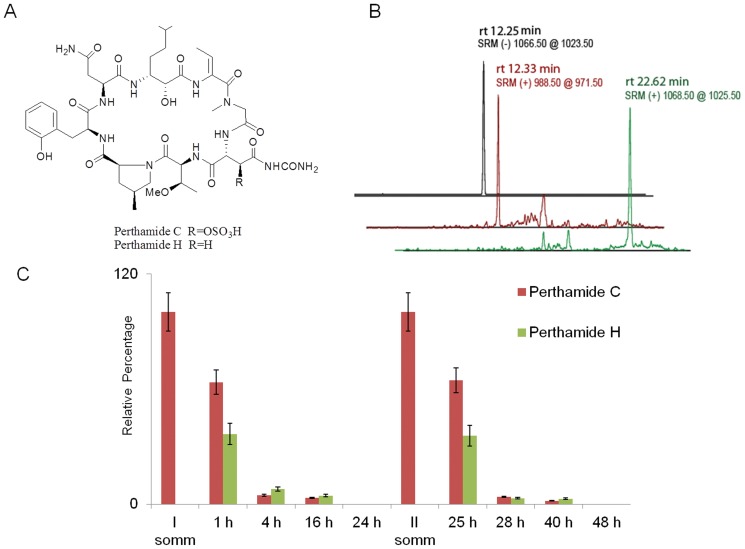
Figure 7. Chemical structure and LCMS runs of perthamide C and H.
Panel A shows the chemical structure of perthamide C and H. Panel B shows one of the LCMS runs for detecting perthamides C and H in mice plasma samples using the selected reaction-monitoring mode (SRM). The peak at rt of 12.25 min corresponds to deprotonated perthamide C, the peak at rt of 12.33 min corresponds to protonated perthamide H, the peak at rt of 22.62 min corresponds to protonated perthamide C. Panel C shows the % of pertamides C and H detected by LCMS in mice plasma samples after 0, 1, 4, 16 and 24 h from each perthamide C administration.

