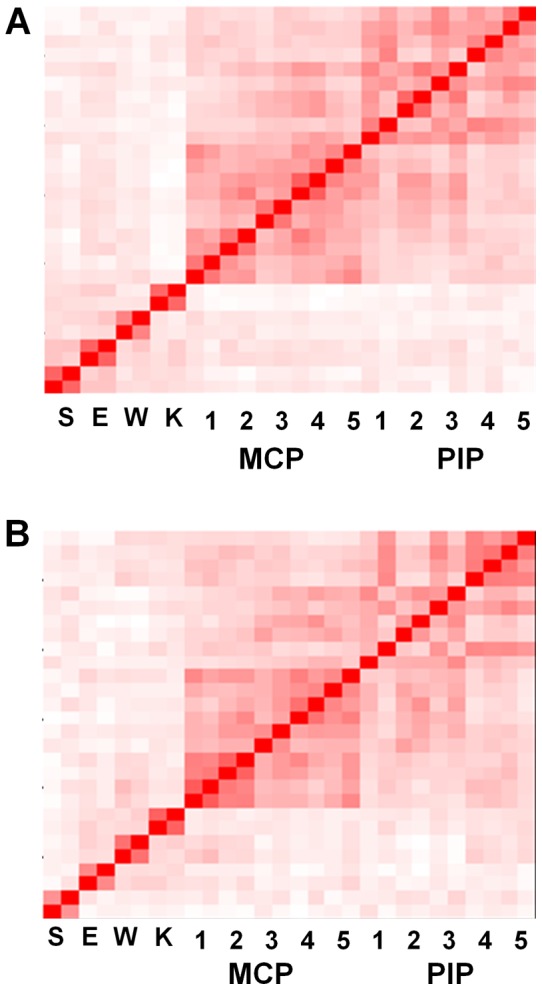
Figure 2. Correlations between the 28 joint symptoms.

Brightness of the red color corresponds to the strength of correlations between joint tenderness (A) or swellings (B), using the Kappa coefficient. Each joint is arranged in the order of right and left. The joint order in the y axis is the same as the x axis. The result is a representative of five analyses based on resampled assessments. S:shoulder, E:elbow, W:wrist, K:knee.
