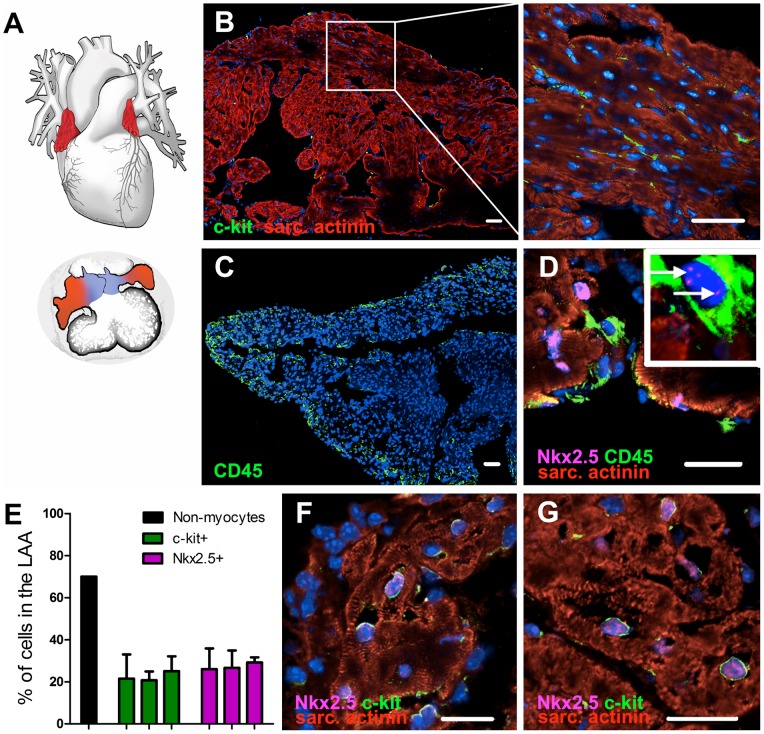
Figure 1. Anatomy and histology of the left atrial appendage.
(A) Location and size of the atrial appendages (red) in the adult heart (top) and in the end stage of heart looping (bottom). Atria (blue) are still small and poorly developed compared to the appendages. (B) A vast population of c-kitpos cells between the cardiomyocytes is found in the LAA of a 12w old mouse (bar = 50 µm). (C and D) CD45pos cells are concentrated in the near vicinity of the epicardium of the LAA with a weaker expression of Nkx2.5 (arrows in the magnified CD45pos cell), bar = 50 µm. (E) Percentage of cells expressing c-kit or Nkx2.5 was compared to the total number of nuclei in the LAA using computer software (Cellprofiler 2.0). Estimated percentage of non-myocyte cells in the whole murine heart, according to the literature [4], is added as a reference. Results obtained from three LAAs are shown in their representative graphs using five threshold levels (mean +SD). (F and G) Evidence of co-expression of c-kit and Nkx2.5 in the CPCs (bar = 50 µm). Abbreviation: sarc. actinin = sarcomeric α-actinin. DAPI = blue.

