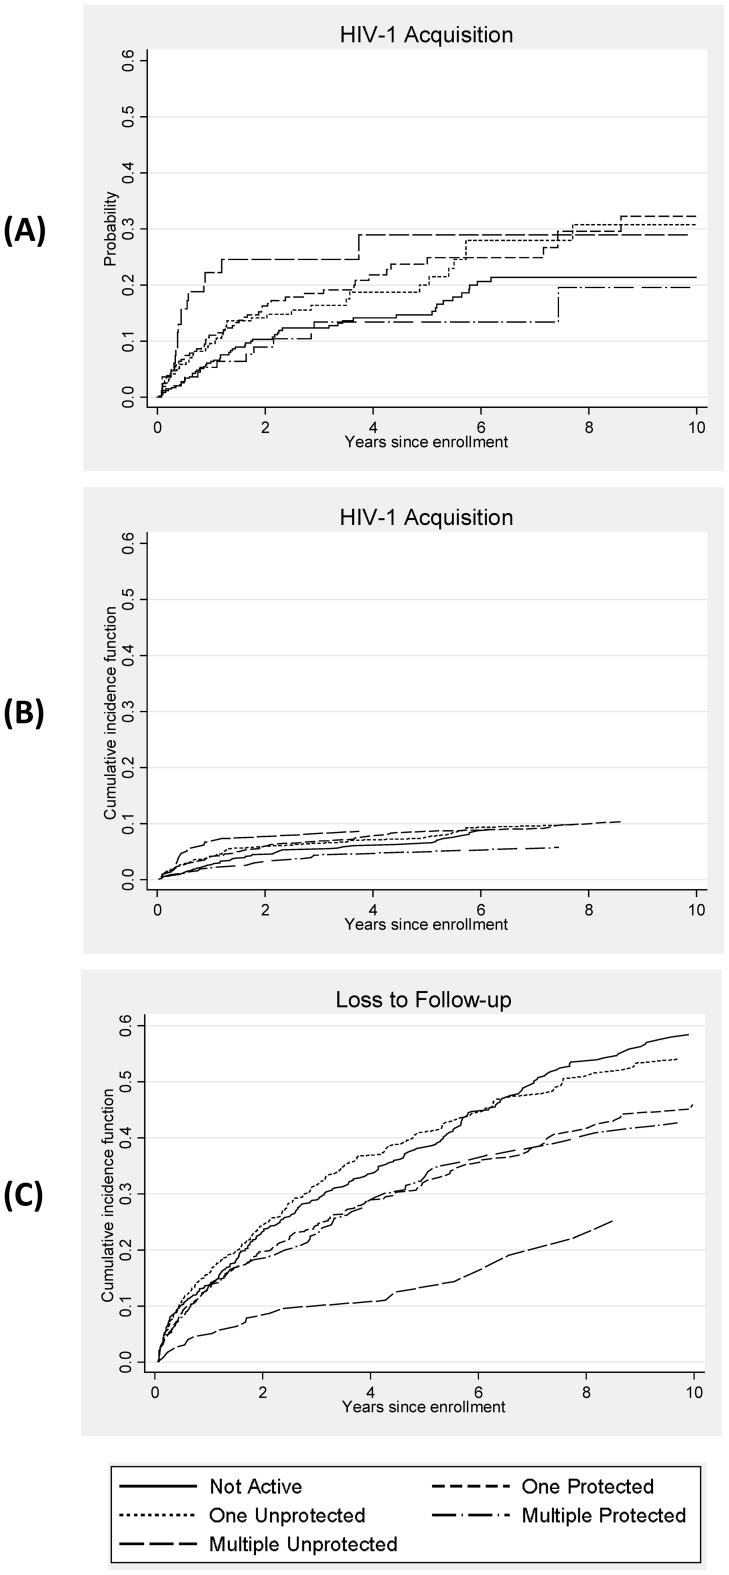
Figure 1. Kaplan-Meier Failure Curve and Cumulative Incidence Functions by Time-Dependent Risk Behavior Category.
Panel A: Kaplan-Meier failure curve for HIV acquisition, Panel B: Cumulative incidence function for HIV acquisition, and Panel C: Cumulative incidence function for loss to follow-up. In each panel, the x axis is the probability of HIV-1 acquisition and on the y axis is years since cohort enrollment. The scale is identical in all three figures. Time-dependent sexual risk behavior is divided into 5 categories based on reported behavior in the past week: not active, protected sex with one partner (“one protected”), unprotected sex with one partner (“one unprotected”), protected sex with multiple partners (“multiple protected”), and unprotected sex with multiple partners (“multiple unprotected”), as indicated in the legend below.

