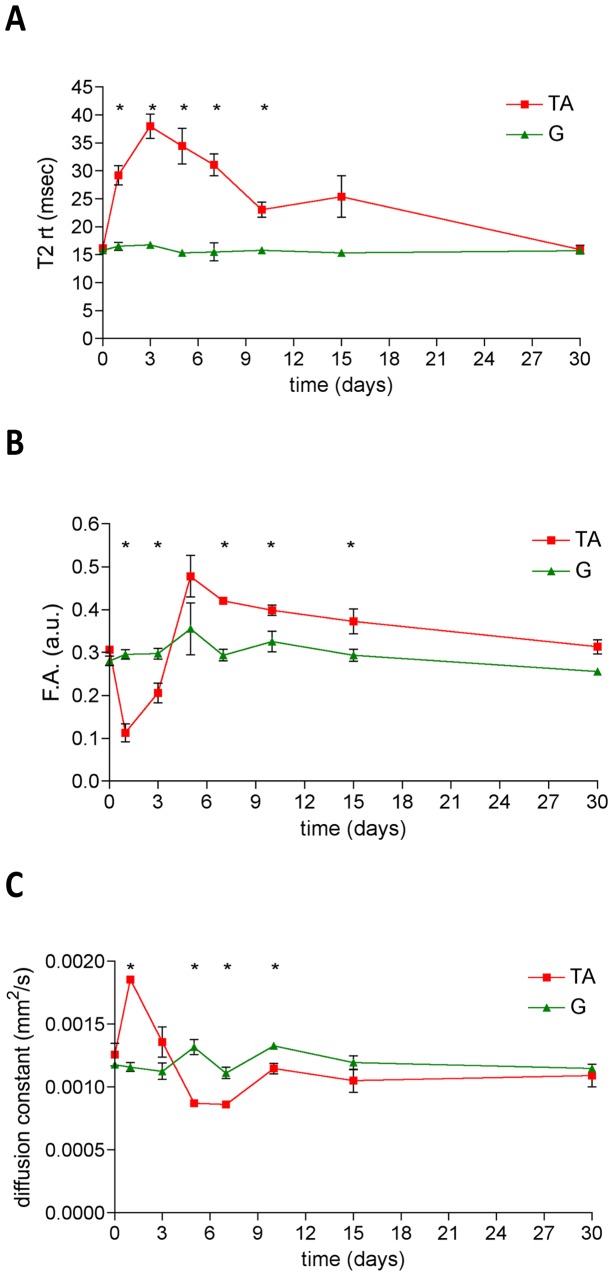
Figure 3. Dynamic changes of MRI parameters during muscle damage and repair.
The graphs show the dynamic trends of T2-rt (panel A), F.A. (panel B) and ADC (panel C) in a longitudinal study of C57Bl/6 mice damaged with CTX and followed by MRI before and at day1, 3, 5, 7, 10, 15 and 30 after damage. Red lines indicate tibialis anterior (TA) parameters while green lines represent gastrocnemius (G) parameters. Asterisks (*) label the tibialis anterior parameters that significantly differ from control gastrocnemius muscle parameters. p<0.05 was considered as statistically significant (n = 7 at each time-point).

