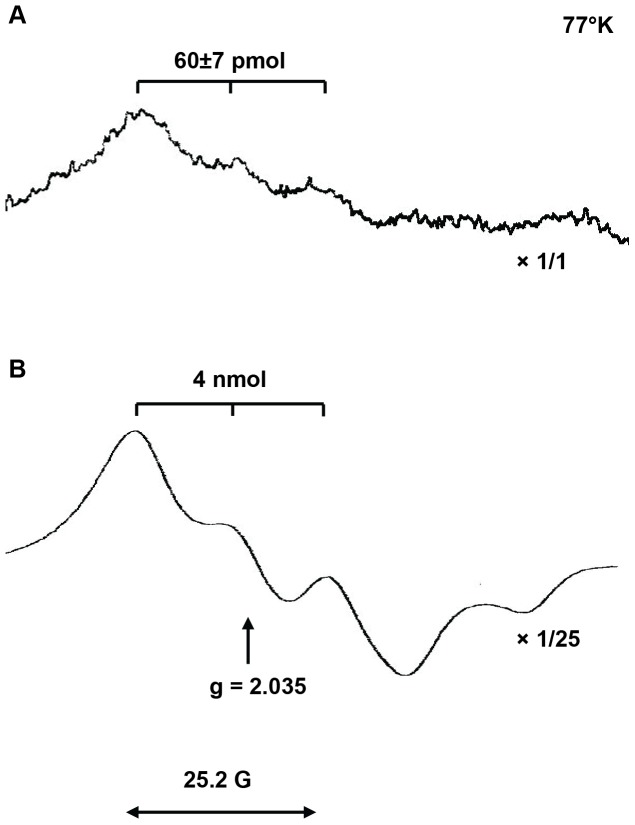
Figure 1. X-band EPR spectra of MNIC at 77°K.
(A). The EPR spectrum from BM cell suspension of ca 100 mln cells. These cells were collected from a DOCA-treated Wistar male rat and stimulated for NO production with Ca-ionophore A23187. The intensity of the spectrum was not changed and was quantified as 60±7 pmol MNIC. (B) The reference spectrum of a strong calibration sample with 4 nmol MNIC, showing the characteristic triplet structure centered around g = 2.035 with a hyperfine splitting of 25.2 G = 2AN 14. The intensity of the reference spectrum was scaled down by a factor 25.

