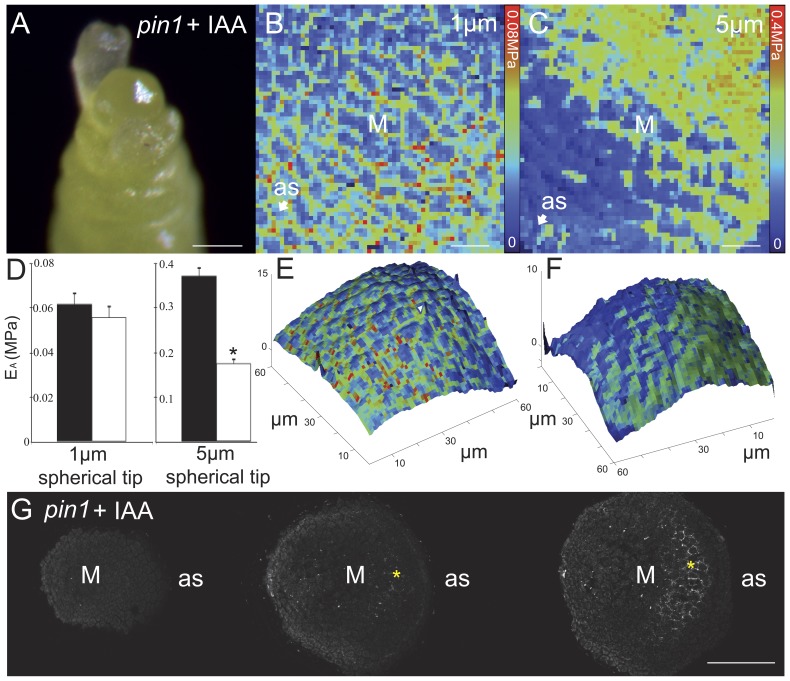
Figure 1. IAA application on pin1 meristem leads to local tissue softening and pectin de-methyl-esterification in sub-epidermal tissues.
(A) IAA induced organ formation in a pin1 mutant inflorescence apex (t = 72 h post application). Apparent Young's modulus (EA, or 'rigidity') map of a representative pin1 meristem ∼18 hours post IAA application as determined with a 1 µm (B) or 5 µm (C) spherical tip. Total number of meristems analyzed + IAA, n = 13. Each pixel in a rigidity map corresponds to the EA value obtained from one indentation point. (D) Graphical display of averaged EA data from all meristems with values for meristem (black bars) and just above application site (white bars). Significant difference indicated by asterisk at p-value<0.01 (T-test on averages from n meristems: ‘pin1–IAA’ 5 µm n = 6 and 1 µm n = 7 (p-values 0.71 and 0.57 respectively), ‘pin1+IAA’ n = 13 (p-values: 1 µm p = 0.02, 5 µm p = 2.2E-5). Error bars are propagated standard deviations). Non-averaged results for all meristems can be found in Figure S1 (displaying reduced rigidity: 1 µm, +Inactive IAA n = 0/7, +IAA n = 1/13. 5 µm, +Inactive IAA n = 3/7, +IAA n = 13/13). (E,F) Topographical reconstruction of measured surfaces, as estimated by AFM point-of-contact, with the rigidity maps of (B,C) respectively used to color the surface. Note that meristem curvature does not correlate with areas of decreased EA, and that there is no bulging of the meristem accompanying decreased rigidity. (G) Serial transverse sections showing 2F4 labeling of HG de-methyl-esterification in a representative pin1 meristem ∼18 hours after IAA application (n = 9). M: meristem, as: application site, Scale bars = 100 µm (A,G) or 10 µm (B,C). Asterisk in (G) indicates 2F4 labeling in sub-epidermal tissues. Statistics in Figure S2, control data in Figure S3.

