
Figure 3. Alterations in PCNA expression in small intestine of KGF treated mice by immunohistochemistry.
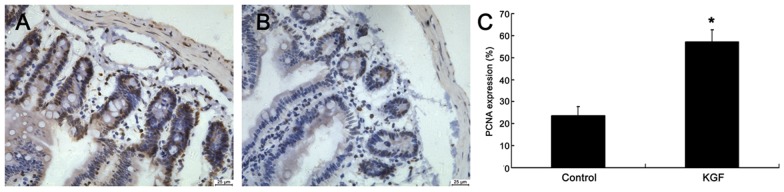
PCNA expression was significantly increased in KGF group (A), as compared to the control group (B). PCNA expression is expressed as means ± SD (C), *P<0.05 vs control group. Original magnification: ×400; n = 6 per group. Scale bar = 25 µm