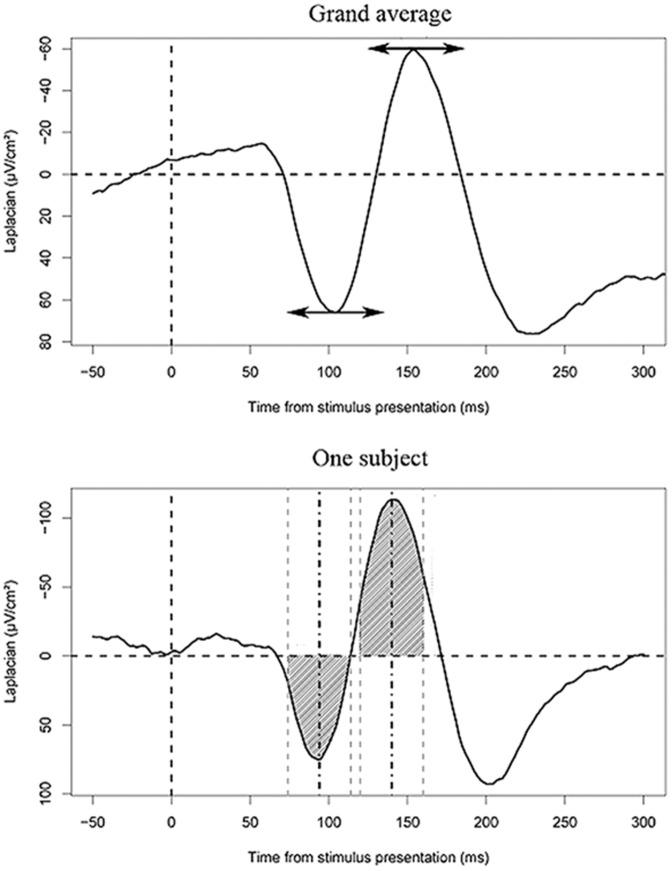
Figure 2. Measuring latencies and peak to peak amplitudes.
Top: On the grand average, a fixed 100 ms time-window is defined around the latencies of the peaks of interest. Bottom: The latencies of the peaks of interest are measured for each participant on the time-windows previously defined on the grand averages. The peaks are defined as the maximum or minimum (for positivities and negativities respectively) of activity in these time-windows. This is done on smoothed data (using a moving average on 40 ms-long time-windows) to be as independent from the noise as possible. Importantly, the peaks were clearly identifiable on a subject-by-subject basis. Then, on the non-smoothed data, the surfaces (hatched areas) between the curve and the zero-line are measured on 40 ms-long time-windows (grey dotted lines) centered on the latencies of the peaks of interest (black dotted lines). Finally, to measure the amplitude of the rise of a peak, negative in this example, the difference between the surface measured around the negative peak and around the preceding positivity is computed. It is this surface difference that we refer to as the peak-to-peak amplitude.

