
Figure 4. Later frontal components time-locked to stimulus presentation (A and B) and to vocal-onset (C and D): Surface Laplacian waveforms and cartographies.
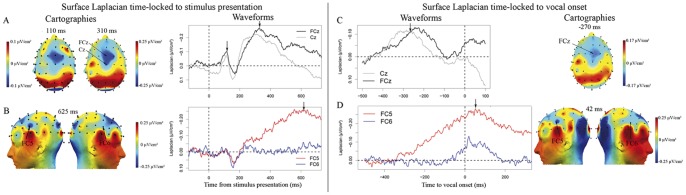
A. At fronto-central sites, there was a first negativity peaking on average 104 ms (σ = 19 ms) post-stimulus onset and a second larger one peaking around 300 ms post-stimulus onset. B. The activity at FC5 continued rising until about 600 ms after stimulus-onset, whereas the slope stayed flat at the contra-lateral recording site, FC6. C. Fronto-central activities at FCz and Cz peaking between 300 and 200 ms before vocal onset. D. Left frontal negativity at FC5 starting to rise about 350 ms before vocal onset and peaking on average 42 ms (σ = 116 ms) post vocal onset. A much smaller activity is visible at the contra-lateral site (FC6), it starts to rise much later than at FC5 (at about 100 ms before vocal onset) and peaks around the same latency as the negativity at FC5. The slope of the activity at FC6 (on the 100 ms preceding vocal onset) is only marginally different from zero (t(11) = −1.35, p = .10).