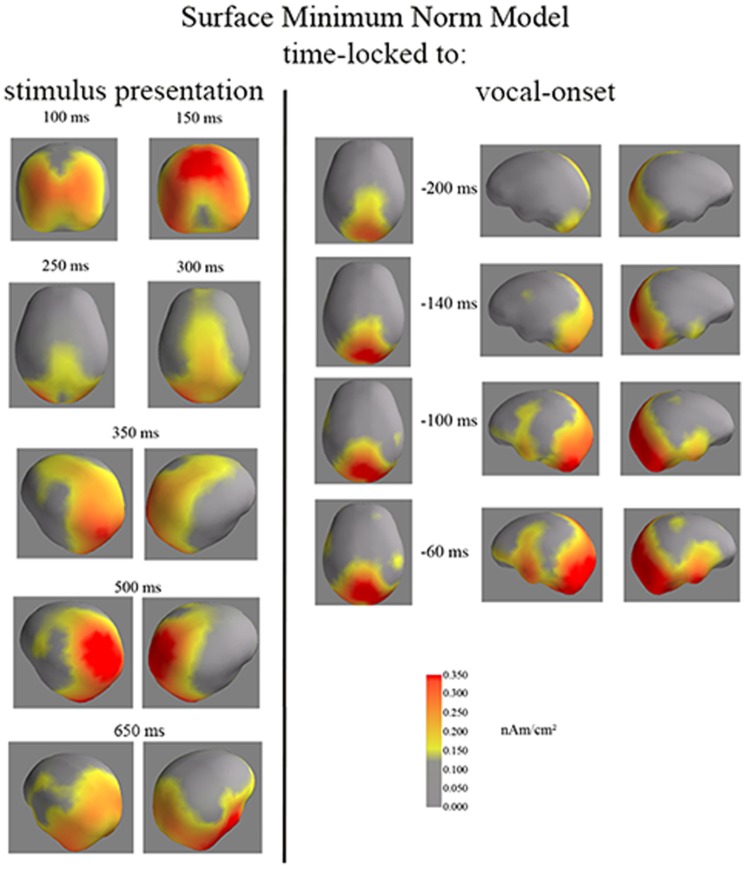
Figure 5. Surface Minimum Norm time-locked to stimulus presentation (left) and to vocal onset (right).
The surface minimum norm images display the occipital and fronto-central activities as well as the left-frontal activity from 100 ms until 650 ms after stimulus presentation and from 200 ms until 60 ms before vocal onset. Time-locked to vocal-onset, the fronto-central activity decreases while the left frontal activity increases. The fronto-central activity is visible at −270 ms (as on the cartographies of the Laplacians) but is less clear than at −200 ms. The left frontal activity starts being visible −140 ms and stays left lateralized until −75 ms. A subject by subject analysis of the significance of activity in this region and contra-lateral one confirms the left frontal activity is present before activity at the contra-lateral site.

