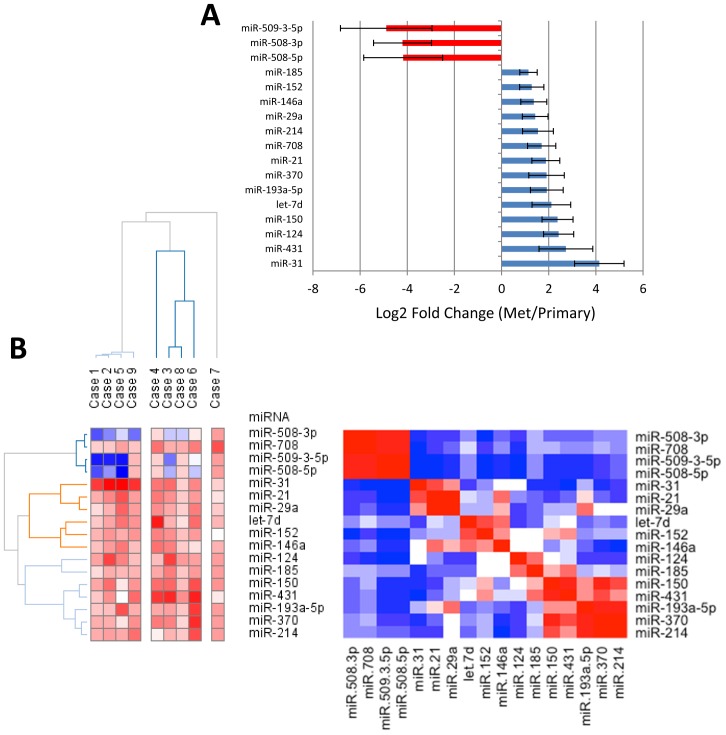
Figure 1. miRNA expression profile of primary and metastatic ovarian tumors.
A. miRNA expression profiling by Taqman qPCR arrays identifies 17 miRNAs differentially expressed between 9 pairs of primary tumors and omental lesions. miRNAs with p<0.05 (paired t-test) were selected. The expression level is presented as the mean +/− standard error of the mean (s.e.m.) of the fold change using the ΔCt method relative to U6 snRNA. Red, lower expression in metastases, blue, higher expression in metastases. B. Left, unsupervised hierarchical clustering of the fold changes of the analyzed patients. Right, association plot analysis of miRNA expression identifies miRNA clusters indicated in red. Clustering was performed in Gene-E ]50].

