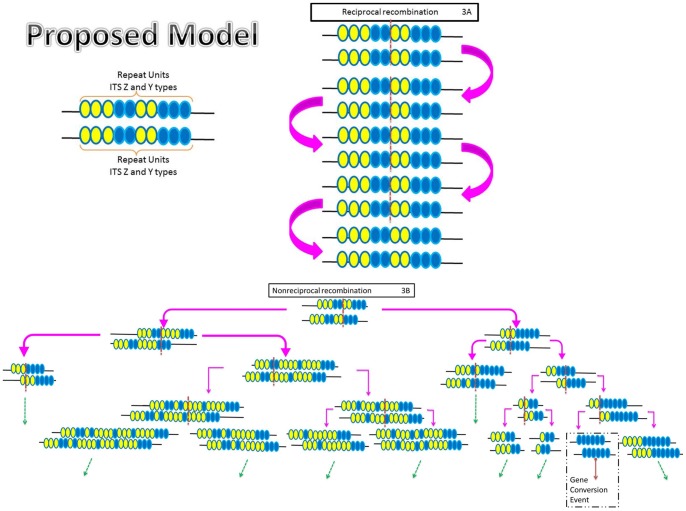
Figure 3. Diagram illustrating a proposed model of concerted evolution in Ceratocystis manginecans.
Concerted evolution is seen as a result of both gene conversion and unequal crossing over occurring during both the meiotic and mitotic life cycles of Ceratocystis manginecans on a hypothetical chromosome which contain both ITS type Z and Y sequences. Yellow circles represent ITS type Z sequence repeat units whilst blue circles represent ITS type Y sequence repeat units. Crossing over (broken red lines) is shown hypothetically as reciprocal recombination (3A) or nonreciprocal recombination (3B) events, in each case the repeat units are subjected to gain and loss events which can result in Gene conversion (solid red line). The broken green arrows indicate multiple unequal crossing events.

