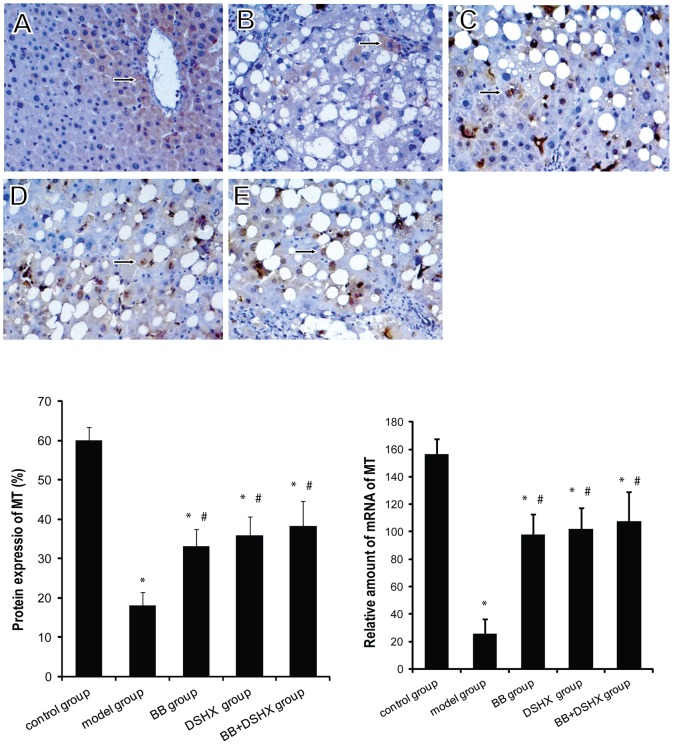
Figure 5. Effect of blueberry juice on MT expression in the rat livers.
The upper panel images show the representative IHC staining of MT protein in the livers of normal control group (A), CCl4-induced hepatic fibrosis group (the model group, B), blueberry juice prevention group (BB group, C), Dan-shao-hua-xian capsule prevention group (DSHX group, D), and blueberry juice+DSHX prevention group (BB+DSHX group, E). Original magnification 400×, arrows indicate positive cytoplasmic/nuclear staining. The lower left panel shows the quantification data of MT protein expression based on the MT IHC staining. The lower right panel shows the mRNA levels of MT in the livers assessed by RT-PCR. *p<0.05 vs. the control group, #p<0.05 vs. the model group.

