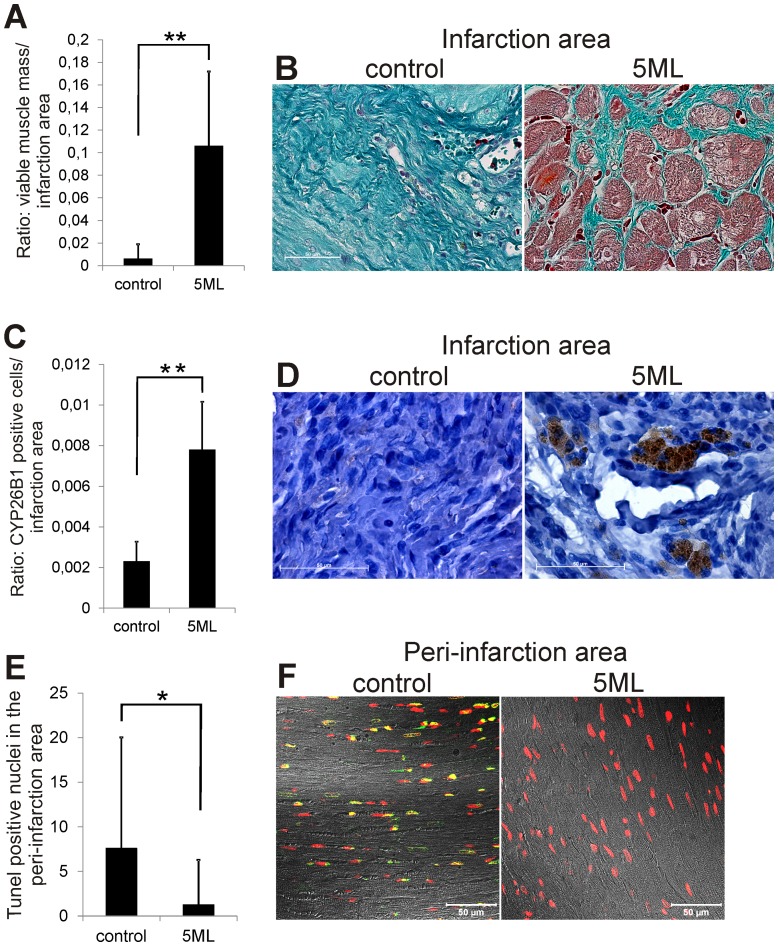
Figure 5. 5ML treatment increase the amount of viable cardiac tissue, increases the CYP26B1 expression in the infarction area, and reduces the number of Tunel positive cells in the peri-infarction area.
Figure 5A shows the quantification of the viable cardiac tissue within the highly fibrotic infarction area (n = 7 per group). Figure 5B shows the staining of heart sections with Masson's Trichrome that visualizes the viable heart muscle (red staining) and the fibrotic area (intensive blue staining) (magnification 63×). Quantitative image analysis (of all images, n = 7 per group) of the CYP26B1 expression in the infarction area is depicted in Figure 5C. Figure 5D shows representative images of CYP26B1-immunohistochemically stained heart sections of control and 5ML treated rat hearts (magnification 100×). Quantification of the number of Tunel positive nuclei in the peri-infarction area is shown in Figure 5E (n = 7 per group). Figure 5F shows representative images of Tunel-stained cardiomyocytes in the per-infarction area of control and 5ML treated rat hearts (magnification 40×). Asterisks indicate significant differences (* p<0.05; ** p<0.01) compared to the corresponding control group.

