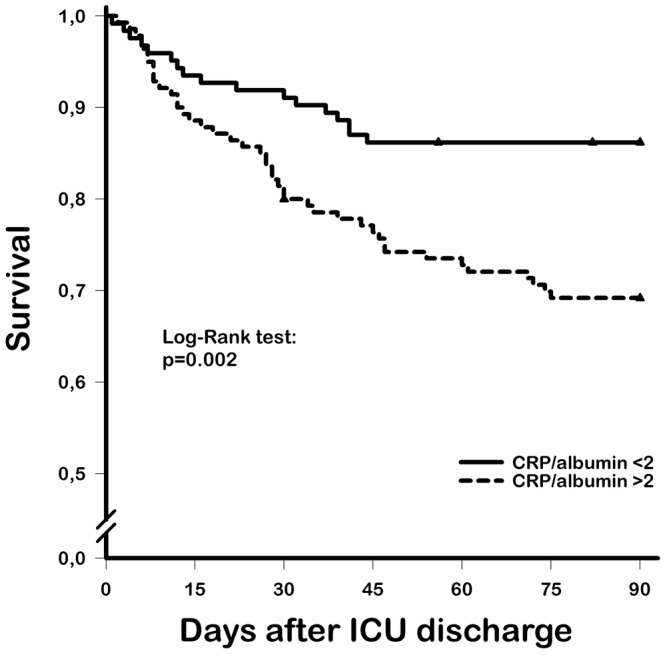
Figure 3. Kaplan-Meier curves showing the 90-day survival of septic patients after discharge from the intensive care unit.

Solid line, CRP/albumin ratio <2 group; dashed line, CRP/albumin ratio >2 group; triangles, censored patients.

Solid line, CRP/albumin ratio <2 group; dashed line, CRP/albumin ratio >2 group; triangles, censored patients.