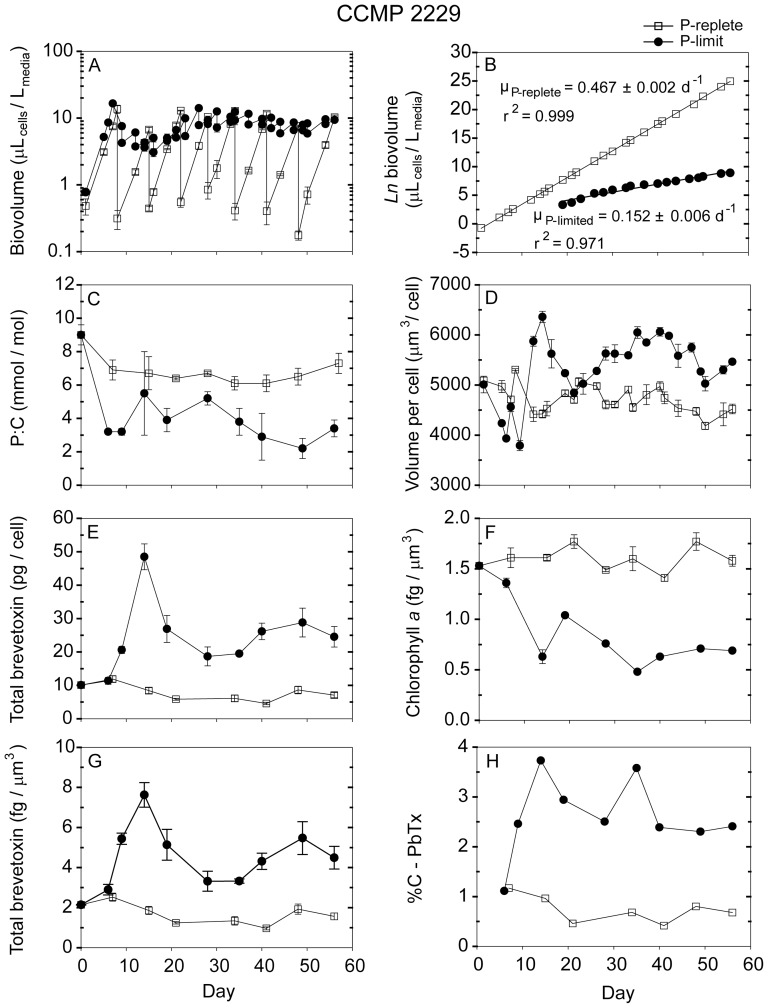
Figure 5. Time dependent results from semi-continuous batch cultures a Karenia brevis strain CCMP 2229 grown at nutrient-replete rates in high-P media (open squares) and grown into P-limitation in low-P media (filled circles).
Biovolume (µLcells/Lmedia) plotted on a log scale vs. time, (B) Natural logarithm (ln) biovolume vs. time, correcting for culture dilution [39], (C) Cellular P:C ratios (mmol/mol), (D) Mean volume per cell (µm3/cell), (E) Total brevetoxins per cell (pg/cell), (F) Chlorophyll a normalized to cell volume (fg/µm3), (G) Total brevetoxins normalized to cell volume (fg/µm3), (H) Percent of cellular carbon associated with brevetoxins (%C-PbTx). Error bars represent the standard deviation of triplicate measurements, except those normalized to carbon, where the cellular C was measured only in duplicate.

