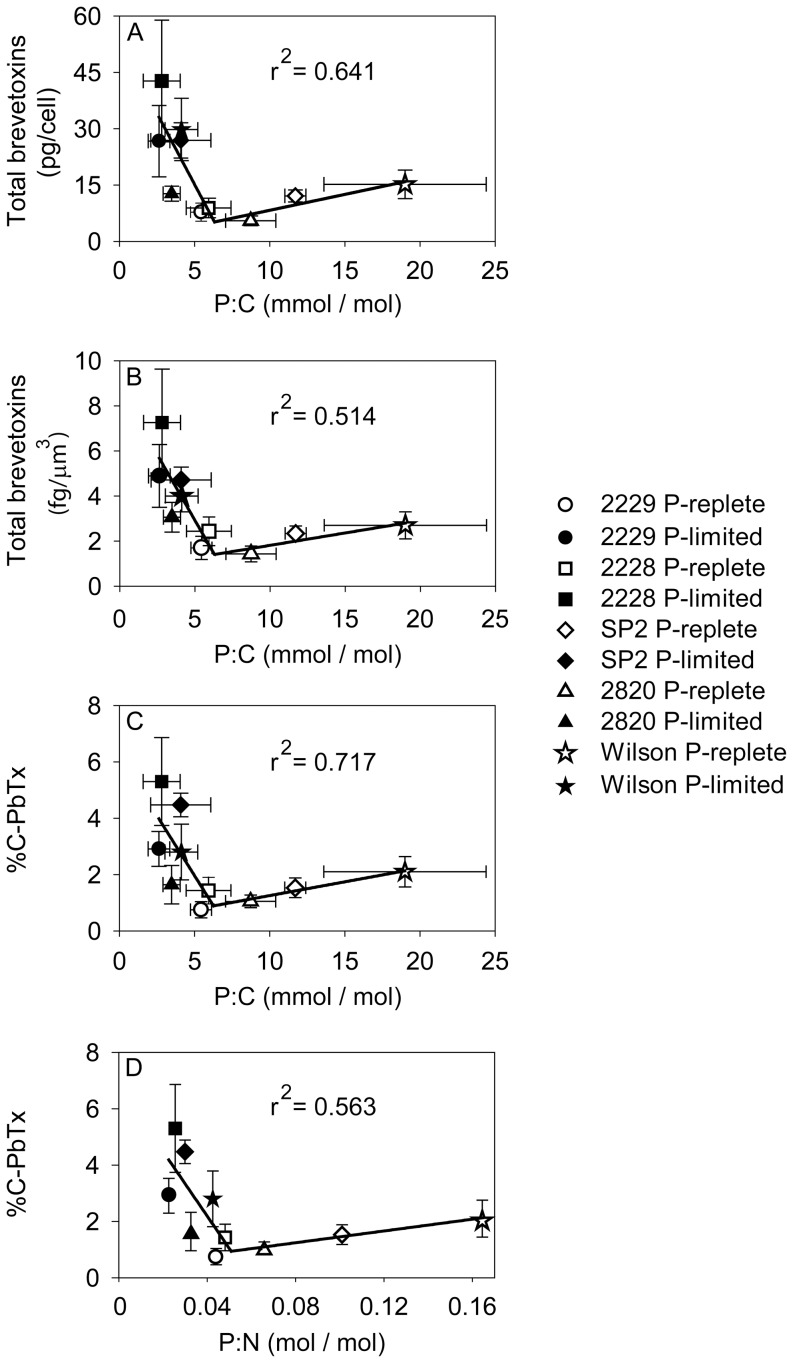
Figure 6. Relationships between cellular brevetoxins and P:C and P:N ratios.
(A) Total brevetoxin per cell (pg/cell) vs. P:C ratio (mmol/mol), (B) Total brevetoxins normalized to cell volume (fg/µm3) vs. P:C (mmol/mol), (C) Percent of total cell carbon present as brevetoxins (%C-PbTx) vs. P:C (mmol/mol), and (D) Percent of total cell carbon present as brevetoxins (%C-PbTx) vs. P:N (mol/mol). Error bars represent standard deviations of triplicate measurements for both x and y values, except those normalized to carbon, where the cellular C was measured only in duplicate. Data from P-replete and P-limited cultures are indicated by open and filled symbols, respectively. Two segment piecewise linear regressions were fit to the data in each panel using the SigmaPlot® 11.2 graphical analysis program.

