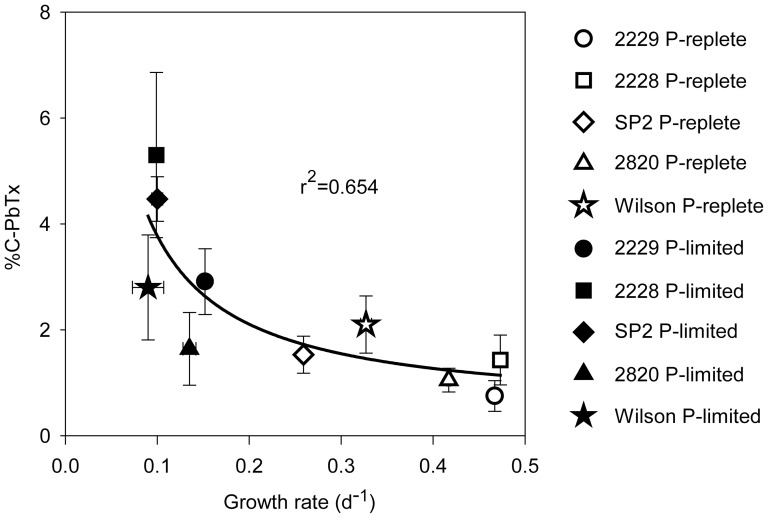
Figure 7. Relationship between cellular brevetoxins expressed as a percent of cell carbon (%C-PbTx) and specific growth rate (d-1).
Results from P-replete and P-limited cultures are indicated by open and filled symbols, respectively. Error bars indicate standard deviations of triplicate measurements of brevetoxins and duplicate measurements of cell carbon. The best fit curve for the data was obtained using the iterative SigmaPlot® 11.2 graphical analysis program.

