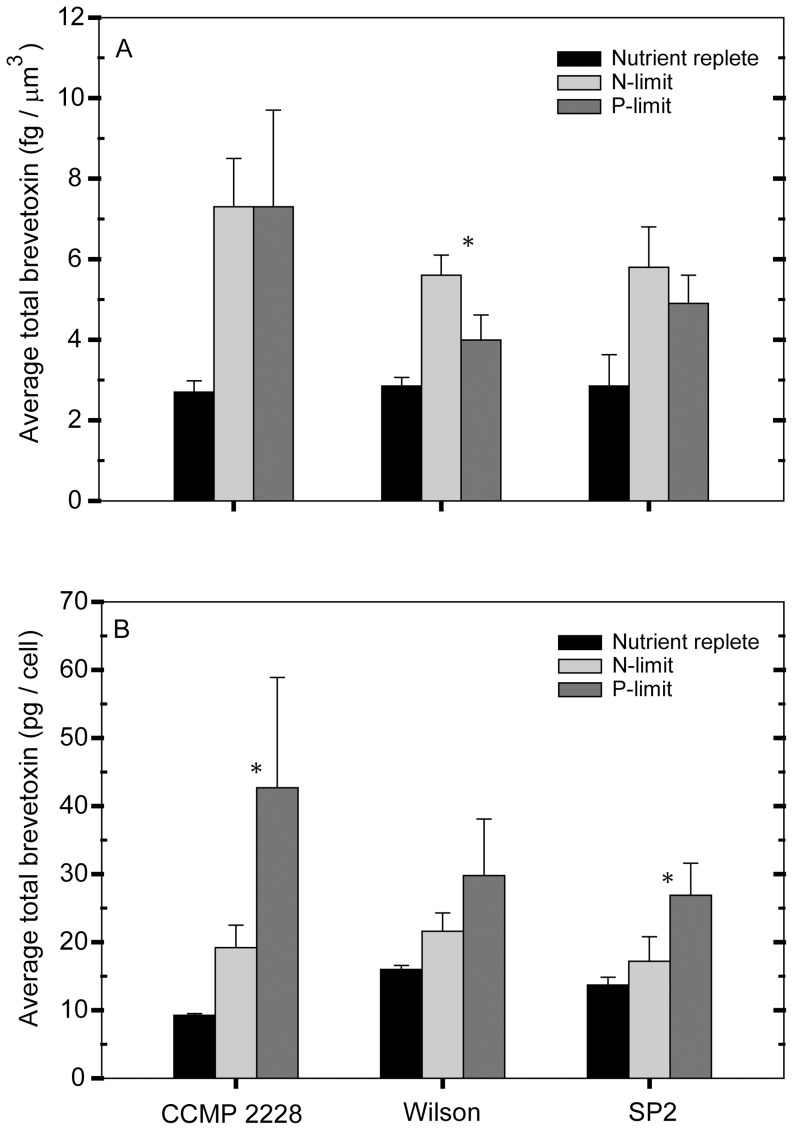
Figure 8. Comparison of N- and P-limitation studies of Karenia brevis.
Average total brevetoxin normalized (A) to cell volume (fg/µm3), and (B) to average total brevetoxin per cell (pg/cell) in nutrient-replete and P-limited cultures in the present study and nutrient-replete and N-limited cultures in a previous study [20]. Average N- and P-limitation values were calculated using data measured after the onset of growth limitation (see methods). Data are presented for the three Karenia brevis strains common to both studies. Statistical differences were assessed using a Kruskal-Wallis one-way ANOVA (p<0.05). All P-limitation treatments were significantly different from the control values. All of the N-limited treatments, with the exception of the Wilson and SP2 strains in panel B, were significantly different from the controls. An asterisk (*) denotes when the N- and P-limitation toxin values for a particular strain were significantly different.

