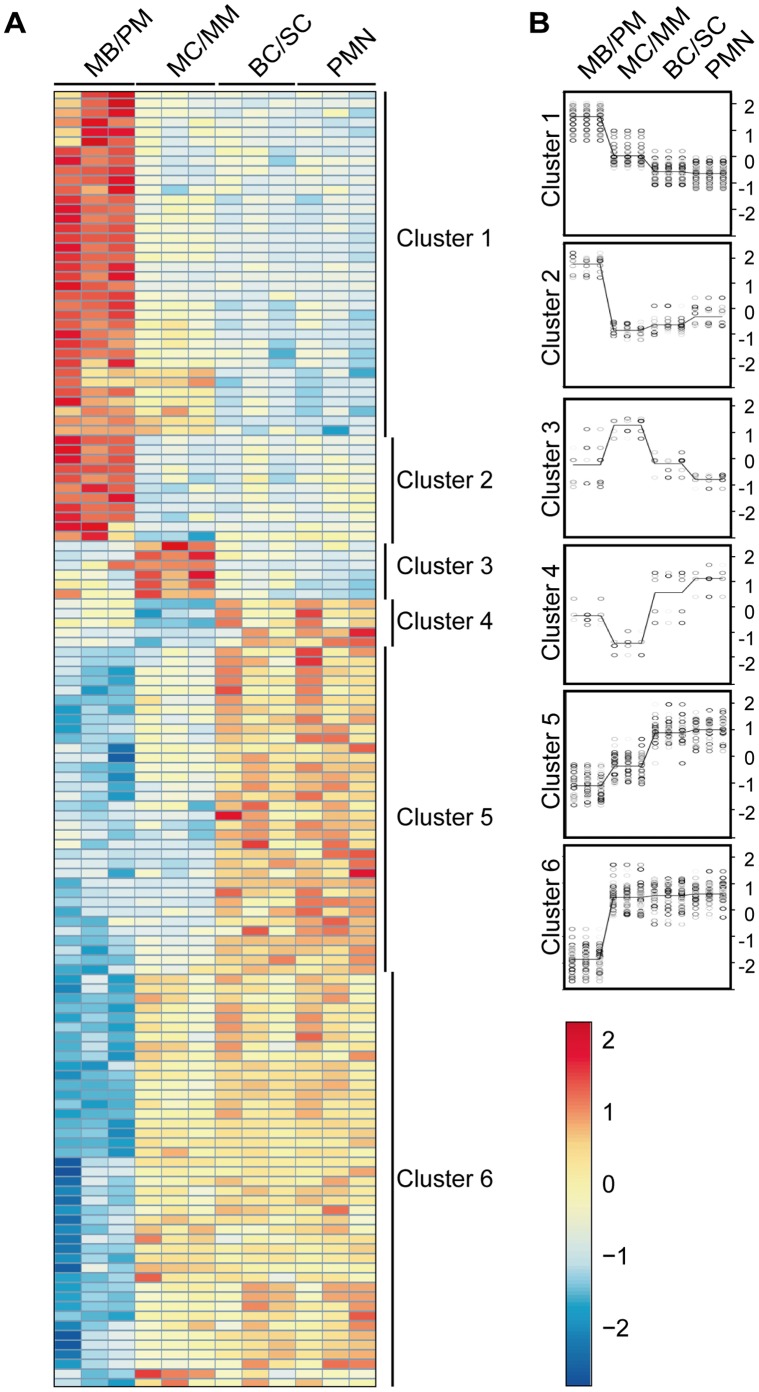
Figure 2. miRNA array analysis of mature human granulocytes and precursors.
A, Heatmap illustrating the different miRNA expression profiles for the 135 differentially regulated miRNAs in bone marrow and peripheral blood (red indicates high expression and blue low expression). Each brick row downwards represents one donor. The four different cell populations are marked on the top of the heatmap and the cluster classification is shown on the right side. B, Using hierarchical cluster analysis (hclust) the cluster affiliation of the different miRNAs was determined showing the different expression profiles on a Log2 scale. Each bullet indicates the expression level of a single miRNA in one donor and the line represents the average expression.

